
SoFi stock declines as Muddy Waters report and technical weakness pressure shares

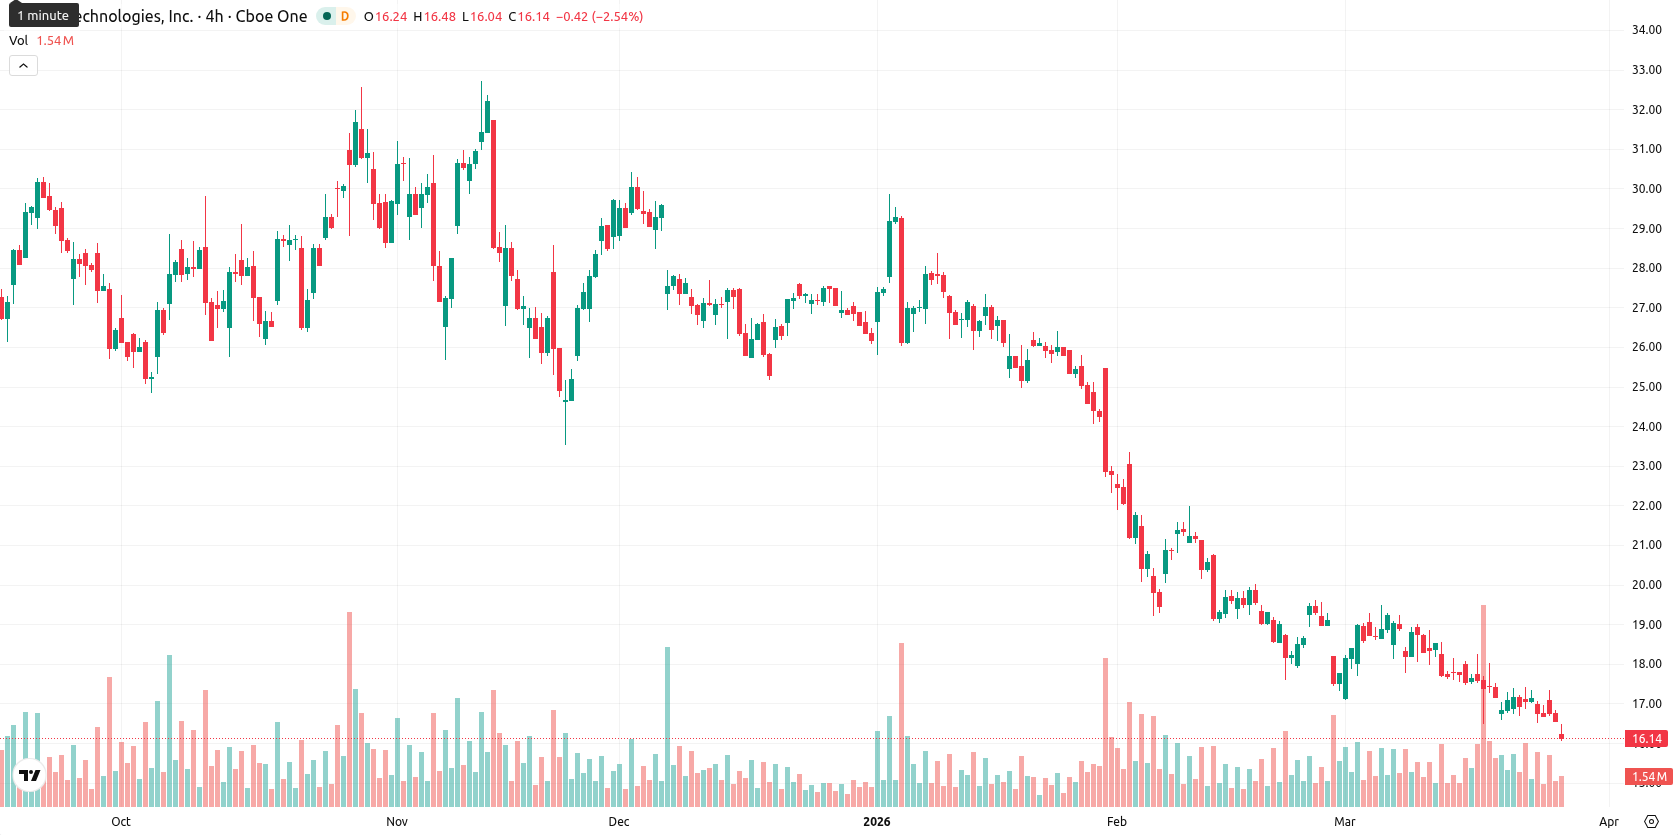
SoFi Technologies, Inc. (SOFI) is trading at $16.06, down 3.02% on the day and hovering near the session low. The share trades well below the MA-20 ($17.92), MA-50 ($20.62), and MA-200 ($23.79), underscoring persistent downward momentum across all major timeframes.
Highlights
- Muddy Waters accused SoFi of improper accounting and underreporting default risk regarding a disputed $312 million loan sale, which SoFi publicly denied.
- Market participants remain divided amid SoFi's defense and CEO Anthony Noto’s share purchase, but shares persist under broad selling pressure.
- Technicals point to persistent bearish momentum, with the price below major averages and an expected range of $15.25–$16.80 over the next five sessions.
Short seller claims and management response drive polarized sentiment
On March 17, short seller Muddy Waters Research published a report alleging that SoFi engaged in improper accounting related to a disputed $312 million loan sale, understated default risk, and retained economic exposure to loans it had classified as sold. SoFi publicly refuted these claims, defended its accounting, and stated intentions to consider legal action. CEO Anthony Noto later purchased additional company shares in the open market. The situation was accompanied by divided viewpoints among major market participants, though price action has remained under broader selling pressure.
Oversold signals intensify as bearish momentum dominates across timeframes
SOFI's current price of $16.06 trades well below the MA-20 ($17.92), MA-50 ($20.62), and MA-200 ($23.79). This setup highlights sustained downside pressure across short, medium, and long-term trends. The Ichimoku Kijun level is $18.25, which acts as immediate resistance for price action. Momentum remains bearish, with both MACD and ADX signaling a firm sell bias. Oscillators point to deep oversold territory, as evidenced by the RSI at 28.78, Stoch RSI at 0.00, and CCI at –115.05. BBP also reflects seller dominance intraday. The Awesome Oscillator’s neutral stance does not contradict the prevailing trend. The stock opened slightly lower ($16.15 vs. previous close $16.56), with today’s price action hovering near the day’s low within a range of $16.05 – $16.48. Volatility is moderate, and there has been consistent pressure following the open, aligning with bearish momentum readings and confirming negative intraday tone.
Range-bound outlook holds with low odds for sustained rebound
For the upcoming five sessions, the expected volatility band relative to current levels is $15.25 – $16.80, based on current volatility and price action. On weak signals from weekly RSI, ADX, MACD, and the MA-50, the probability of a significant upward move is assessed below 20%. The base case scenario is for SOFI to remain in a sideways corridor. A break above immediate resistance at $18.25 could lead to upside momentum, while a move below $15.25 would indicate renewed selling pressure and a retest of lower support.
Earlier, analysts noted that SoFi was experiencing persistent selling pressure driven by negative technicals and heightened short-seller scrutiny. The current analysis reaffirms this bearish outlook, highlighting the importance of monitoring the $15.25 level as a potential trigger for renewed downside momentum in the sessions ahead.


Latest SoFi News


-
 Afghanistan
-
 Albania
-
 Algeria
-
 Angola
-
 Argentina
-
 Armenia
-
 Australia
-
 Austria
-
 Azerbaijan
-
 Bahamas
-
 Bahrain
-
 Bangladesh
-
 Belarus
-
 Belgium
-
 Bolivia
-
 Botswana
-
 Brazil
-
 Brunei
-
 Bulgaria
-
 Cambodia
-
 Cameroon
-
 Canada
-
 Chile
Chile
-
 China
China
-
 Colombia
-
 Congo
Congo
-
 Costa Rica
-
 Cote d'Ivoire
-
 Croatia
-
 Cuba
Cuba
-
 Cyprus
-
 Czechia
-
 DR Congo
-
 Denmark
-
 Dominican Republic
-
 Ecuador
-
 Egypt
Egypt
-
 El Salvador
-
 Estonia
-
 Eswatini
-
 Ethiopia
-
 Finland
-
 France
-
 Georgia
-
 Germany
-
 Ghana
Ghana
-
 Greece
-
 Haiti
Haiti
-
 Hong Kong
-
 Hungary
-
 India
India
-
 Indonesia
-
 Iran, Islamic republic
-
 Iraq
Iraq
-
 Ireland
-
 Israel
-
 Italy
Italy
-
 Jamaica
-
 Japan
Japan
-
 Jordan
-
 Kazakhstan
-
 Kenya
Kenya
-
 Korea
Korea
-
 Kuwait
-
 Kyrgyzstan
-
 Laos
Laos
-
 Latvia
-
 Lebanon
-
 Lesotho
-
 Libya
Libya
-
 Lithuania
-
 Luxembourg
-
 Madagascar
-
 Malaysia
-
 Malta
Malta
-
 Mauritius
-
 Mexico
-
 Moldova
-
 Mongolia
-
 Montenegro
-
 Morocco
-
 Mozambique
-
 Myanmar
-
 Namibia
-
 Nepal
Nepal
-
 Netherlands
-
 New Zealand
-
 Nigeria
-
 North Macedonia
-
 Norway
-
 Oman
Oman
-
 Pakistan
-
 Palestine
-
 Panama
-
 Papua New Guinea
-
 Paraguay
-
 Peru
Peru
-
 Philippines
-
 Poland
-
 Portugal
-
 Puerto Rico
-
 Qatar
Qatar
-
 Reunion
-
 Romania
-
 Rwanda
-
 Saudi Arabia
-
 Serbia
-
 Singapore
-
 Slovakia
-
 Slovenia
-
 Somalia
-
 South Africa
-
 Spain
Spain
-
 Sri Lanka
-
 Sweden
-
 Switzerland
-
 Syria
Syria
-
 Taiwan
-
 Tajikistan
-
 Tanzania
-
 Thailand
-
 Trinidad and Tobago
-
 Tunisia
-
 Turkey
-
 UAE
UAE
-
 Uganda
-
 Ukraine
-
 United Kingdom
-
United States
-
 Uruguay
-
 Uzbekistan
-
 Venezuela
-
 Vietnam
-
 Yemen
Yemen
-
 Zambia
-
 Zimbabwe
- Forex
- Crypto
