
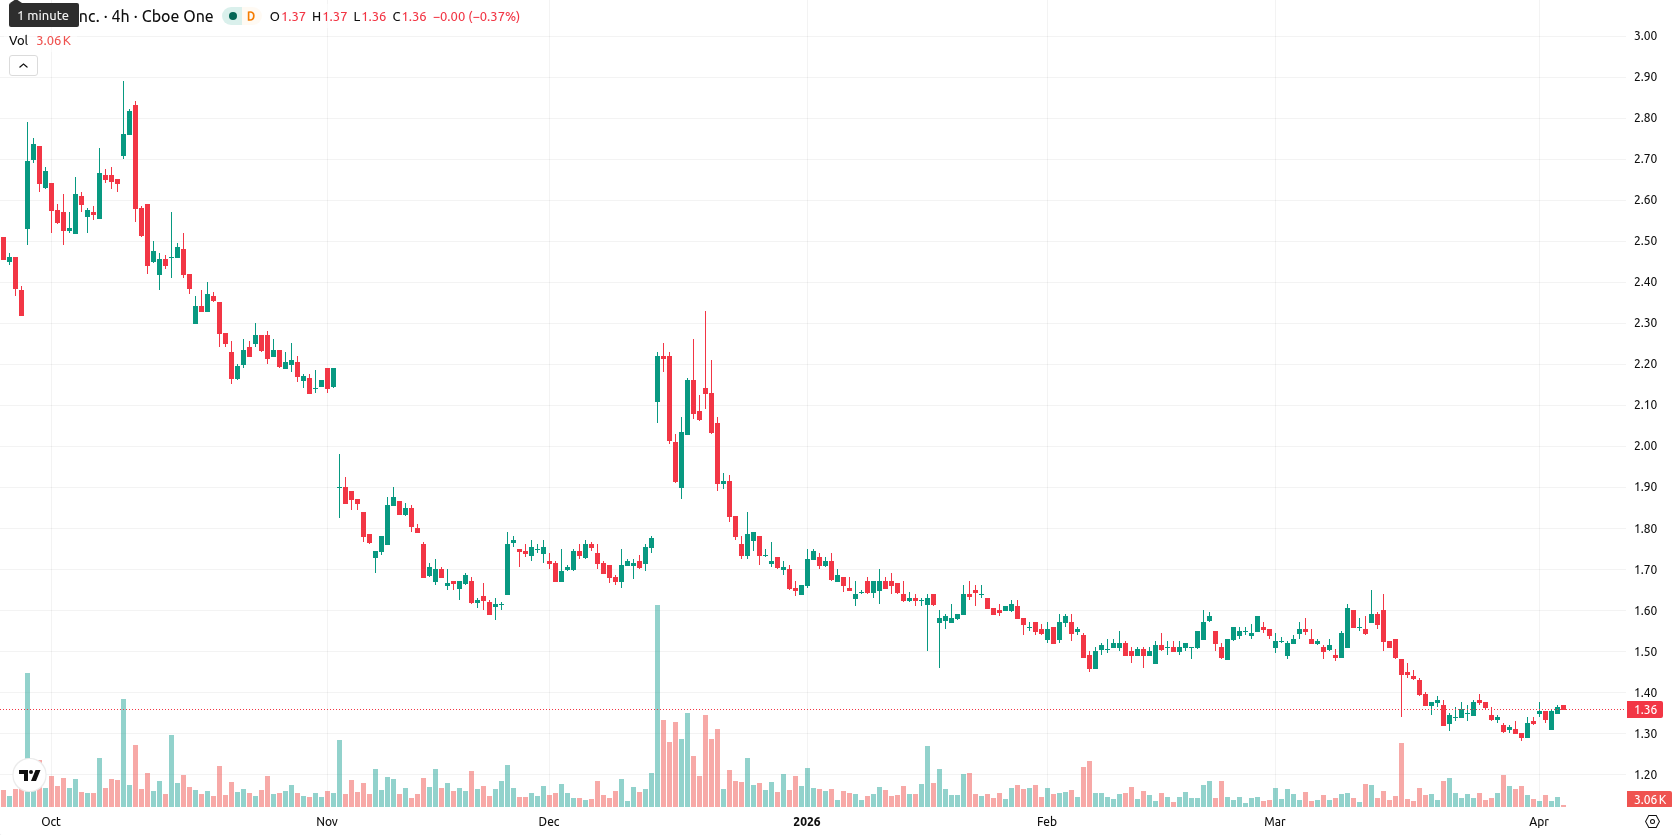
Sundial Growers stock consolidates as price tests $1.47 resistance

Sundial Growers Inc. (SNDL) is trading at $1.3600, below the MA-20 ($1.41), MA-50 ($1.49), and MA-200 ($1.82), signaling ongoing downward pressure in the short, medium, and long term. The Ichimoku Kijun on the daily chart stands at $1.47, which now acts as immediate resistance.
Highlights
- SNDL remains under sustained downward pressure, trading below key moving averages signaling bearish sentiment across all timeframes.
- Technical indicators show persistent weakness with sellers maintaining control, but a divergence among oscillators points to underlying uncertainty.
- Forecast range for the next five sessions is $1.3550 to $1.4450, with sub-20% probability of a rebound and further declines favored if support fails.
Bearish signals persist amid oscillator divergence and subdued volatility
MACD D1 points to strong bearish momentum, while the ADX D1 (22.71, Sell) shows the trend is present but not particularly strong. RSI D1 is at 41.85 (Sell) and CCI D1 is at -55.89 (Sell), both suggesting no oversold condition but signaling weakness; however, Stoch RSI D1 indicates the market is overbought at 100, creating a clear divergence among oscillators. BBP D1 signals sellers in control, narrowing buyers' ability to lift prices in the session. The daily change is mild, with the price slipping 0.37% after a small opening gap up, currently near the session’s low within a narrow intraday range — volatility is low and the tone is under slight pressure after the open. Momentum signals overall reinforce the bearish tone, though the divergence in oscillators highlights uncertainty.
Further downside likely as upside probability remains limited
For the next five trading days, the expected price range is $1.3550 to $1.4450. The probability of a price increase is very low (less than 20%), making a further decline the more likely outcome. Baseline scenario: price continues sideways between $1.36 and $1.44, reflecting recent consolidation. Bullish scenario: if bulls reclaim momentum and break above the $1.47 resistance, a move toward $1.44 is possible. Bearish scenario: a fall below $1.3550 could open room for further downside, with sellers likely to dominate if key support levels give way.
Earlier, analysts noted that Sundial Growers was under sustained bearish pressure, with technical indicators suggesting limited upside and the risk of further declines. The current analysis reinforces this outlook amid persistent seller dominance, making a decisive move below $1.3550 a critical level for traders to monitor as an early signal of escalating downside risk.


-
 Afghanistan
-
 Albania
-
 Algeria
-
 Angola
-
 Argentina
-
 Armenia
-
 Australia
-
 Austria
-
 Azerbaijan
-
 Bahamas
-
 Bahrain
-
 Bangladesh
-
 Belarus
-
 Belgium
-
 Bolivia
-
 Botswana
-
 Brazil
-
 Brunei
-
 Bulgaria
-
 Cambodia
-
 Cameroon
-
 Canada
-
 Chile
Chile
-
 China
China
-
 Colombia
-
 Congo
Congo
-
 Costa Rica
-
 Cote d'Ivoire
-
 Croatia
-
 Cuba
Cuba
-
 Cyprus
-
 Czechia
-
 DR Congo
-
 Denmark
-
 Dominican Republic
-
 Ecuador
-
 Egypt
Egypt
-
 El Salvador
-
 Estonia
-
 Eswatini
-
 Ethiopia
-
 Finland
-
 France
-
 Georgia
-
 Germany
-
 Ghana
Ghana
-
 Greece
-
 Haiti
Haiti
-
 Hong Kong
-
 Hungary
-
 India
India
-
 Indonesia
-
 Iran, Islamic republic
-
 Iraq
Iraq
-
 Ireland
-
 Israel
-
 Italy
Italy
-
 Jamaica
-
 Japan
Japan
-
 Jordan
-
 Kazakhstan
-
 Kenya
Kenya
-
 Korea
Korea
-
 Kuwait
-
 Kyrgyzstan
-
 Laos
Laos
-
 Latvia
-
 Lebanon
-
 Lesotho
-
 Libya
Libya
-
 Lithuania
-
 Luxembourg
-
 Madagascar
-
 Malaysia
-
 Malta
Malta
-
 Mauritius
-
 Mexico
-
 Moldova
-
 Mongolia
-
 Montenegro
-
 Morocco
-
 Mozambique
-
 Myanmar
-
 Namibia
-
 Nepal
Nepal
-
 Netherlands
-
 New Zealand
-
 Nigeria
-
 North Macedonia
-
 Norway
-
 Oman
Oman
-
 Pakistan
-
 Palestine
-
 Panama
-
 Papua New Guinea
-
 Paraguay
-
 Peru
Peru
-
 Philippines
-
 Poland
-
 Portugal
-
 Puerto Rico
-
 Qatar
Qatar
-
 Reunion
-
 Romania
-
 Rwanda
-
 Saudi Arabia
-
 Serbia
-
 Singapore
-
 Slovakia
-
 Slovenia
-
 Somalia
-
 South Africa
-
 Spain
Spain
-
 Sri Lanka
-
 Sweden
-
 Switzerland
-
 Syria
Syria
-
 Taiwan
-
 Tajikistan
-
 Tanzania
-
 Thailand
-
 Trinidad and Tobago
-
 Tunisia
-
 Turkey
-
 UAE
UAE
-
 Uganda
-
 Ukraine
-
 United Kingdom
-
United States
-
 Uruguay
-
 Uzbekistan
-
 Venezuela
-
 Vietnam
-
 Yemen
Yemen
-
 Zambia
-
 Zimbabwe
- Forex
- Crypto
