
Sundial Growers stock price forecast: $1.47 resistance holds as SNDL declines 3.86%

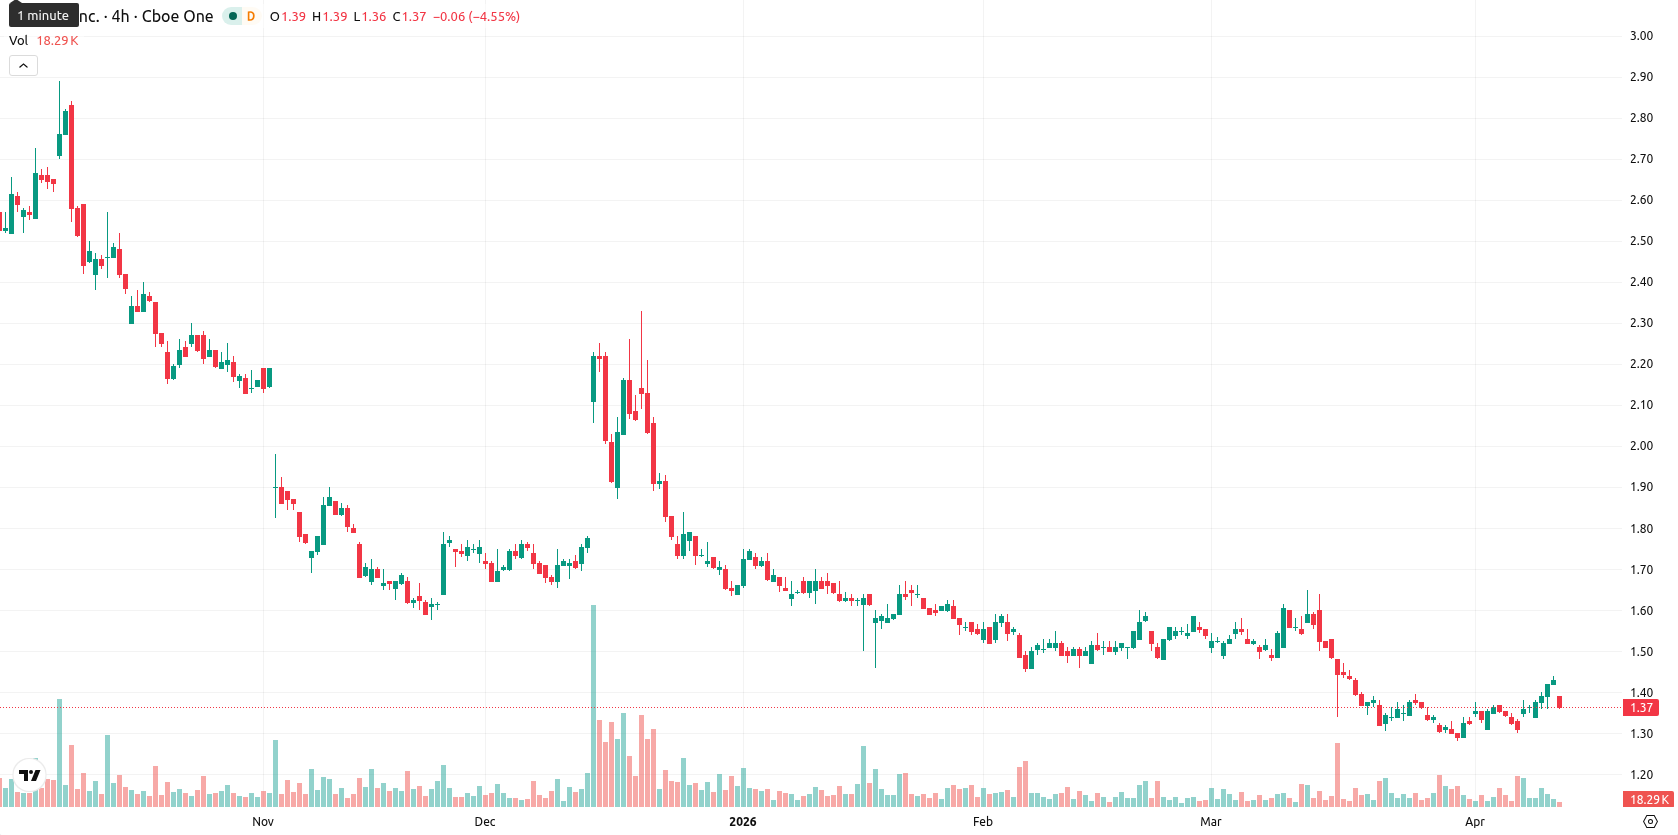
Sundial Growers Inc. (SNDL) is trading at $1.37, matching its SMA-20 and sitting slightly below the EMA-20. The stock remains under pressure in both the medium and long term, as it trades well below the SMA-50 at $1.47 and the SMA-200 at $1.82; immediate resistance is at the Ichimoku Kijun level of $1.47.
Highlights
- SNDL trades below key medium- and long-term moving averages, signaling persistent bearish pressure and limited recovery prospects.
- Momentum and oscillator indicators are mixed, with MACD signalling strong selling while RSI and CCI reveal mild optimism.
- Price is expected to remain in a tight $1.32–$1.42 range, with downside risk elevated if $1.32 support breaks.
Bearish bias diverges as sellers dominate amid weak trend
Momentum readings show that MACD on the daily is a strong sell and ADX weakens at 22, signaling a bearish bias but without strong trend strength. RSI at 52.8 is neutral-bullish, Stoch RSI is overbought, and CCI shows mild optimism, revealing a divergence among oscillators. BBP points to ongoing buyer support, but today's drop of 3.86% from the previous close, without a gap at the open, places the price near today’s low in a tight trading range and suggests low volatility alongside steady selling pressure after the open.
Sideways trading likely as bullish probability remains low
The typical 5-day volatility band is expected to fall between $1.32 and $1.42 given the current technical and volatility setup. The probability of a move higher is very low (less than 20%), making further declines more likely. The baseline scenario is for SNDL to trade sideways within this current band. A bullish scenario would first require a breakout above $1.47 resistance, whereas a break below $1.32 could prompt accelerated downside.
Earlier, analysts noted that Sundial Growers was entrenched in a bearish technical setup with downside risks outweighing the chance of sustained recovery. The current data strengthens this negative outlook, with new momentum readings and persistent weakness reinforcing $1.32 as a pivotal support level that, if breached, could unleash further declines.


-
 Afghanistan
-
 Albania
-
 Algeria
-
 Angola
-
 Argentina
-
 Armenia
-
 Australia
-
 Austria
-
 Azerbaijan
-
 Bahamas
-
 Bahrain
-
 Bangladesh
-
 Belarus
-
 Belgium
-
 Bolivia
-
 Botswana
-
 Brazil
-
 Brunei
-
 Bulgaria
-
 Cambodia
-
 Cameroon
-
 Canada
-
 Chile
Chile
-
 China
China
-
 Colombia
-
 Congo
Congo
-
 Costa Rica
-
 Cote d'Ivoire
-
 Croatia
-
 Cuba
Cuba
-
 Cyprus
-
 Czechia
-
 DR Congo
-
 Denmark
-
 Dominican Republic
-
 Ecuador
-
 Egypt
Egypt
-
 El Salvador
-
 Estonia
-
 Eswatini
-
 Ethiopia
-
 Finland
-
 France
-
 Georgia
-
 Germany
-
 Ghana
Ghana
-
 Greece
-
 Haiti
Haiti
-
 Hong Kong
-
 Hungary
-
 India
India
-
 Indonesia
-
 Iran, Islamic republic
-
 Iraq
Iraq
-
 Ireland
-
 Israel
-
 Italy
Italy
-
 Jamaica
-
 Japan
Japan
-
 Jordan
-
 Kazakhstan
-
 Kenya
Kenya
-
 Korea
Korea
-
 Kuwait
-
 Kyrgyzstan
-
 Laos
Laos
-
 Latvia
-
 Lebanon
-
 Lesotho
-
 Libya
Libya
-
 Lithuania
-
 Luxembourg
-
 Madagascar
-
 Malaysia
-
 Malta
Malta
-
 Mauritius
-
 Mexico
-
 Moldova
-
 Mongolia
-
 Montenegro
-
 Morocco
-
 Mozambique
-
 Myanmar
-
 Namibia
-
 Nepal
Nepal
-
 Netherlands
-
 New Zealand
-
 Nigeria
-
 North Macedonia
-
 Norway
-
 Oman
Oman
-
 Pakistan
-
 Palestine
-
 Panama
-
 Papua New Guinea
-
 Paraguay
-
 Peru
Peru
-
 Philippines
-
 Poland
-
 Portugal
-
 Puerto Rico
-
 Qatar
Qatar
-
 Reunion
-
 Romania
-
 Rwanda
-
 Saudi Arabia
-
 Serbia
-
 Singapore
-
 Slovakia
-
 Slovenia
-
 Somalia
-
 South Africa
-
 Spain
Spain
-
 Sri Lanka
-
 Sweden
-
 Switzerland
-
 Syria
Syria
-
 Taiwan
-
 Tajikistan
-
 Tanzania
-
 Thailand
-
 Trinidad and Tobago
-
 Tunisia
-
 Turkey
-
 UAE
UAE
-
 Uganda
-
 Ukraine
-
 United Kingdom
-
United States
-
 Uruguay
-
 Uzbekistan
-
 Venezuela
-
 Vietnam
-
 Yemen
Yemen
-
 Zambia
-
 Zimbabwe
- Forex
- Crypto
