
META stock edges lower supported by continued bullish structure above major moving averages: weekly review

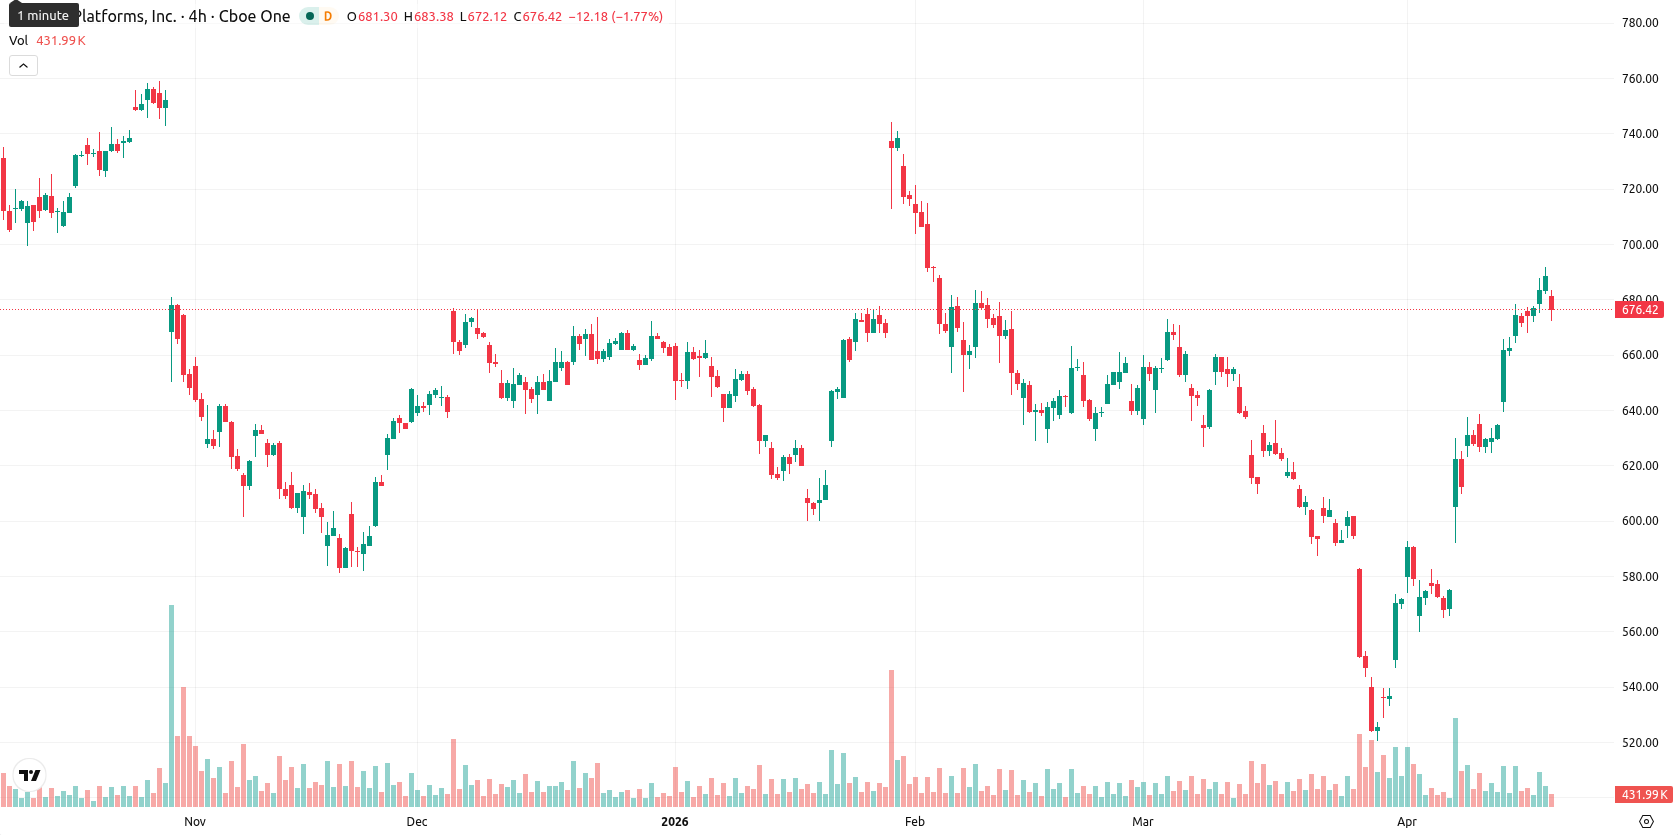
Meta Platforms, Inc. (META, formerly Facebook) is currently trading at $676.36, positioning the stock above its weekly MA-20 ($640.81), slightly above MA-50 ($675.90), and well above MA-200 ($444.88), supporting a strong bullish trend for both the medium and long term. Over the past week, Meta declined $11.86 (1.80%), with the price closing in the upper part of its weekly range.
Highlights
- Meta trades in a bullish structure above key moving averages despite a 1.8% weekly pullback within upper range consolidation.
- Technical indicators show mixed momentum with overbought signals and a neutral trend, suggesting a potential near-term pullback.
- Expected price range for the next week is $621 to $732, with an evenly split probability of breakout or further decline.
AI-driven restructuring and job cuts reshape sentiment this week
Meta is initiating a major restructuring beginning May 20, which will see approximately 8,000 employees laid off in the first phase as the company pivots significant resources toward artificial intelligence infrastructure. Capital expenditures are expected to surge to $115 billion to $135 billion for 2026, reflecting the increasing priority of AI investment. The recent 2025 financial report showed strong revenue growth, and additional restructuring and new AI-focused teams are planned ahead of the upcoming Q1 2026 earnings call on April 29.
Mixed momentum signals with overbought risk despite bullish structure
Technical indicators on the W1 timeframe display a mixed outlook: price maintains a bullish structure above major moving averages, with dynamic support near the MA-50 at $675.90. Volatility for the week was 8.15%. MACD signals a strong sell, while ADX is neutral. Weekly RSI and CCI suggest active buyers, though both Bull/Bear Power and Stochastic RSI show overbought conditions, indicating potential for a near-term pullback. The Awesome Oscillator remains neutral, with the price consolidating after attempting to reach recent highs.
Oscillation likely as breakout risk hinges on overbought reversals
For the next five trading days, Meta is expected to fluctuate between $621 and $732, in line with recent volatility metrics. With two out of four key indicators signaling a buy or strong buy, there is a balanced probability for upward or downward movement (50% each way). The baseline scenario is for the price to oscillate within this corridor. If buyers regain momentum, a breakout above $732 is possible, while a break below $621 could prompt further declines, especially if overbought readings begin to reverse.
Earlier, analysts noted that Meta’s bullish trajectory was tempered by overbought conditions and a likelihood of near-term consolidation. The current restructuring and elevated capital expenditures add a new dimension to the outlook, with investors advised to monitor the $732 resistance as a breakout above this level could signal renewed upside momentum despite ongoing volatility.


Latest META News


-
 Afghanistan
-
 Albania
-
 Algeria
-
 Angola
-
 Argentina
-
 Armenia
-
 Australia
-
 Austria
-
 Azerbaijan
-
 Bahamas
-
 Bahrain
-
 Bangladesh
-
 Belarus
-
 Belgium
-
 Bolivia
-
 Botswana
-
 Brazil
-
 Brunei
-
 Bulgaria
-
 Cambodia
-
 Cameroon
-
 Canada
-
 Chile
Chile
-
 China
China
-
 Colombia
-
 Congo
Congo
-
 Costa Rica
-
 Cote d'Ivoire
-
 Croatia
-
 Cuba
Cuba
-
 Cyprus
-
 Czechia
-
 DR Congo
-
 Denmark
-
 Dominican Republic
-
 Ecuador
-
 Egypt
Egypt
-
 El Salvador
-
 Estonia
-
 Eswatini
-
 Ethiopia
-
 Finland
-
 France
-
 Georgia
-
 Germany
-
 Ghana
Ghana
-
 Greece
-
 Haiti
Haiti
-
 Hong Kong
-
 Hungary
-
 India
India
-
 Indonesia
-
 Iran, Islamic republic
-
 Iraq
Iraq
-
 Ireland
-
 Israel
-
 Italy
Italy
-
 Jamaica
-
 Japan
Japan
-
 Jordan
-
 Kazakhstan
-
 Kenya
Kenya
-
 Korea
Korea
-
 Kuwait
-
 Kyrgyzstan
-
 Laos
Laos
-
 Latvia
-
 Lebanon
-
 Lesotho
-
 Libya
Libya
-
 Lithuania
-
 Luxembourg
-
 Madagascar
-
 Malaysia
-
 Malta
Malta
-
 Mauritius
-
 Mexico
-
 Moldova
-
 Mongolia
-
 Montenegro
-
 Morocco
-
 Mozambique
-
 Myanmar
-
 Namibia
-
 Nepal
Nepal
-
 Netherlands
-
 New Zealand
-
 Nigeria
-
 North Macedonia
-
 Norway
-
 Oman
Oman
-
 Pakistan
-
 Palestine
-
 Panama
-
 Papua New Guinea
-
 Paraguay
-
 Peru
Peru
-
 Philippines
-
 Poland
-
 Portugal
-
 Puerto Rico
-
 Qatar
Qatar
-
 Reunion
-
 Romania
-
 Rwanda
-
 Saudi Arabia
-
 Serbia
-
 Singapore
-
 Slovakia
-
 Slovenia
-
 Somalia
-
 South Africa
-
 Spain
Spain
-
 Sri Lanka
-
 Sweden
-
 Switzerland
-
 Syria
Syria
-
 Taiwan
-
 Tajikistan
-
 Tanzania
-
 Thailand
-
 Trinidad and Tobago
-
 Tunisia
-
 Turkey
-
 UAE
UAE
-
 Uganda
-
 Ukraine
-
 United Kingdom
-
United States
-
 Uruguay
-
 Uzbekistan
-
 Venezuela
-
 Vietnam
-
 Yemen
Yemen
-
 Zambia
-
 Zimbabwe
- Forex
- Crypto
