
Tesla stock consolidates as vehicle deliveries miss Wall Street estimates

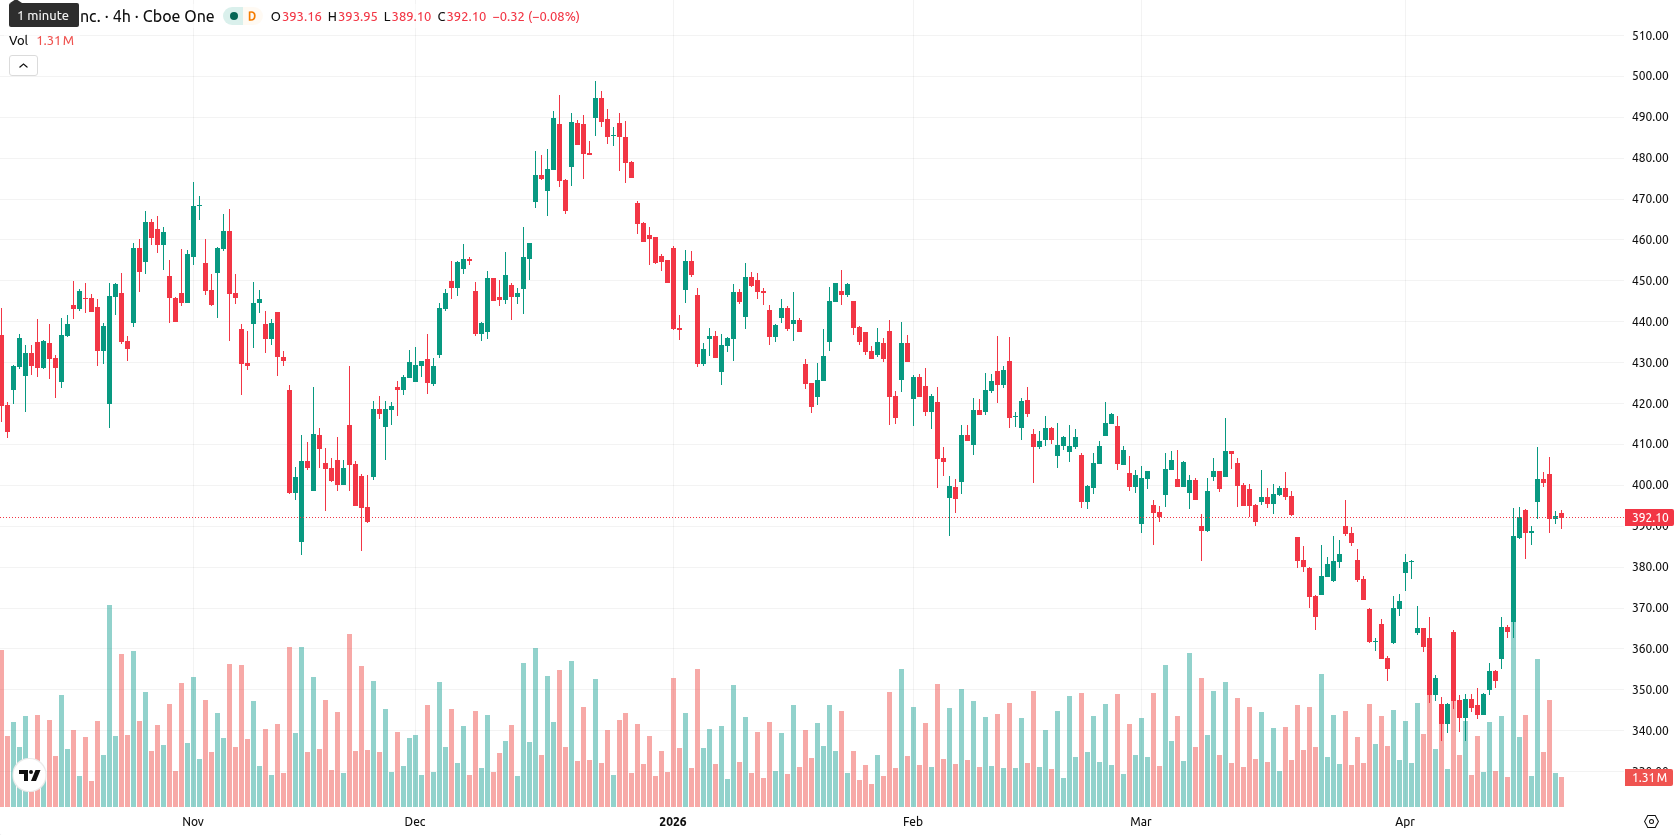
Tesla, Inc. (TSLA) closed at $391.57, down 0.18% on the day. The share price is currently positioned above its short- and medium-term moving averages, while remaining under longer-term trend resistance.
Highlights
- Tesla missed Q1 2026 expectations, delivering 358,023 vehicles while inventories rose by over 50,000 units and energy storage deployments fell sharply.
- Stronger results are anticipated from Tesla’s energy storage and solar division than its automotive segment, with CEO Musk set to address robotaxi development, inventory, and capex concerns.
- Technical signals are mixed, with overbought conditions suggesting near-term downside risk and TSLA likely consolidating between $384.00 and $399.00 in the coming week.
Inventory surge and energy unit decline weigh on earnings sentiment
Tesla is scheduled to release its first-quarter 2026 earnings report after the U.S. market close on April 22. During the quarter, the company delivered 358,023 vehicles, which was below Wall Street’s forecast, as inventory increased by 50,363 units and energy storage deployments fell to 8.8 GWh from 14.2 GWh. Stronger performance is expected in Tesla’s energy storage and solar business compared to its automotive segment in these results. CEO Elon Musk will address investor questions regarding robotaxi progress, inventory, and capital expenditures during the earnings call, though price action has remained under broader selling pressure.
Overbought signals and near-resistance halt momentum despite bullish bias
TSLA is trading above the SMA-20 at $369.03 and the SMA-50 at $390.24 but remains just below the SMA-200 at $399.24, which now acts as a key long-term resistance. The Ichimoku Kijun level at $373.16 provides immediate support, with the price currently sitting just above it. Among momentum signals, ADX stands at 21.58 (Buy), while MACD is neutral. The RSI is at 56.26 (Buy), reflecting moderate bullish momentum, but oscillators such as the Stoch RSI at 84.91 (Overbought) and CCI at 103.98 (Overbought) highlight potential for a short-term pause or pullback. BBP reads overbought levels, showing recent buyer dominance, and the Awesome Oscillator signals a strong buy; however, the divergence between these indicators and overbought conditions points to rising short-term risks.
Consolidation outlook as volatility governs near-term TSLA direction
Over the next five trading days, TSLA is likely to trade within a volatility band between $384.00 and $399.00, consistent with typical short-term price fluctuations. Current technicals indicate a consolidation scenario as the baseline. A bullish move above $399.00 would set the stage for a retest of longer-term resistance, while a bearish break below $384.00 could expose the stock to further downside toward the lower end of the recent range.
Earlier, analysts noted that Tesla was experiencing mixed technical momentum amid regulatory uncertainty and potential downside risk. The current setup reinforces this cautious outlook, as overbought signals and soft delivery numbers ahead of earnings highlight the importance of monitoring the $399 resistance for any bullish breakout or potential pullback.


Latest Tesla News


-
 Afghanistan
-
 Albania
-
 Algeria
-
 Angola
-
 Argentina
-
 Armenia
-
 Australia
-
 Austria
-
 Azerbaijan
-
 Bahamas
-
 Bahrain
-
 Bangladesh
-
 Belarus
-
 Belgium
-
 Bolivia
-
 Botswana
-
 Brazil
-
 Brunei
-
 Bulgaria
-
 Cambodia
-
 Cameroon
-
 Canada
-
 Chile
Chile
-
 China
China
-
 Colombia
-
 Congo
Congo
-
 Costa Rica
-
 Cote d'Ivoire
-
 Croatia
-
 Cuba
Cuba
-
 Cyprus
-
 Czechia
-
 DR Congo
-
 Denmark
-
 Dominican Republic
-
 Ecuador
-
 Egypt
Egypt
-
 El Salvador
-
 Estonia
-
 Eswatini
-
 Ethiopia
-
 Finland
-
 France
-
 Georgia
-
 Germany
-
 Ghana
Ghana
-
 Greece
-
 Haiti
Haiti
-
 Hong Kong
-
 Hungary
-
 India
India
-
 Indonesia
-
 Iran, Islamic republic
-
 Iraq
Iraq
-
 Ireland
-
 Israel
-
 Italy
Italy
-
 Jamaica
-
 Japan
Japan
-
 Jordan
-
 Kazakhstan
-
 Kenya
Kenya
-
 Korea
Korea
-
 Kuwait
-
 Kyrgyzstan
-
 Laos
Laos
-
 Latvia
-
 Lebanon
-
 Lesotho
-
 Libya
Libya
-
 Lithuania
-
 Luxembourg
-
 Madagascar
-
 Malaysia
-
 Malta
Malta
-
 Mauritius
-
 Mexico
-
 Moldova
-
 Mongolia
-
 Montenegro
-
 Morocco
-
 Mozambique
-
 Myanmar
-
 Namibia
-
 Nepal
Nepal
-
 Netherlands
-
 New Zealand
-
 Nigeria
-
 North Macedonia
-
 Norway
-
 Oman
Oman
-
 Pakistan
-
 Palestine
-
 Panama
-
 Papua New Guinea
-
 Paraguay
-
 Peru
Peru
-
 Philippines
-
 Poland
-
 Portugal
-
 Puerto Rico
-
 Qatar
Qatar
-
 Reunion
-
 Romania
-
 Rwanda
-
 Saudi Arabia
-
 Serbia
-
 Singapore
-
 Slovakia
-
 Slovenia
-
 Somalia
-
 South Africa
-
 Spain
Spain
-
 Sri Lanka
-
 Sweden
-
 Switzerland
-
 Syria
Syria
-
 Taiwan
-
 Tajikistan
-
 Tanzania
-
 Thailand
-
 Trinidad and Tobago
-
 Tunisia
-
 Turkey
-
 UAE
UAE
-
 Uganda
-
 Ukraine
-
 United Kingdom
-
United States
-
 Uruguay
-
 Uzbekistan
-
 Venezuela
-
 Vietnam
-
 Yemen
Yemen
-
 Zambia
-
 Zimbabwe
- Forex
- Crypto
