
Sundial Growers stock trades up as value lags well below long-term average

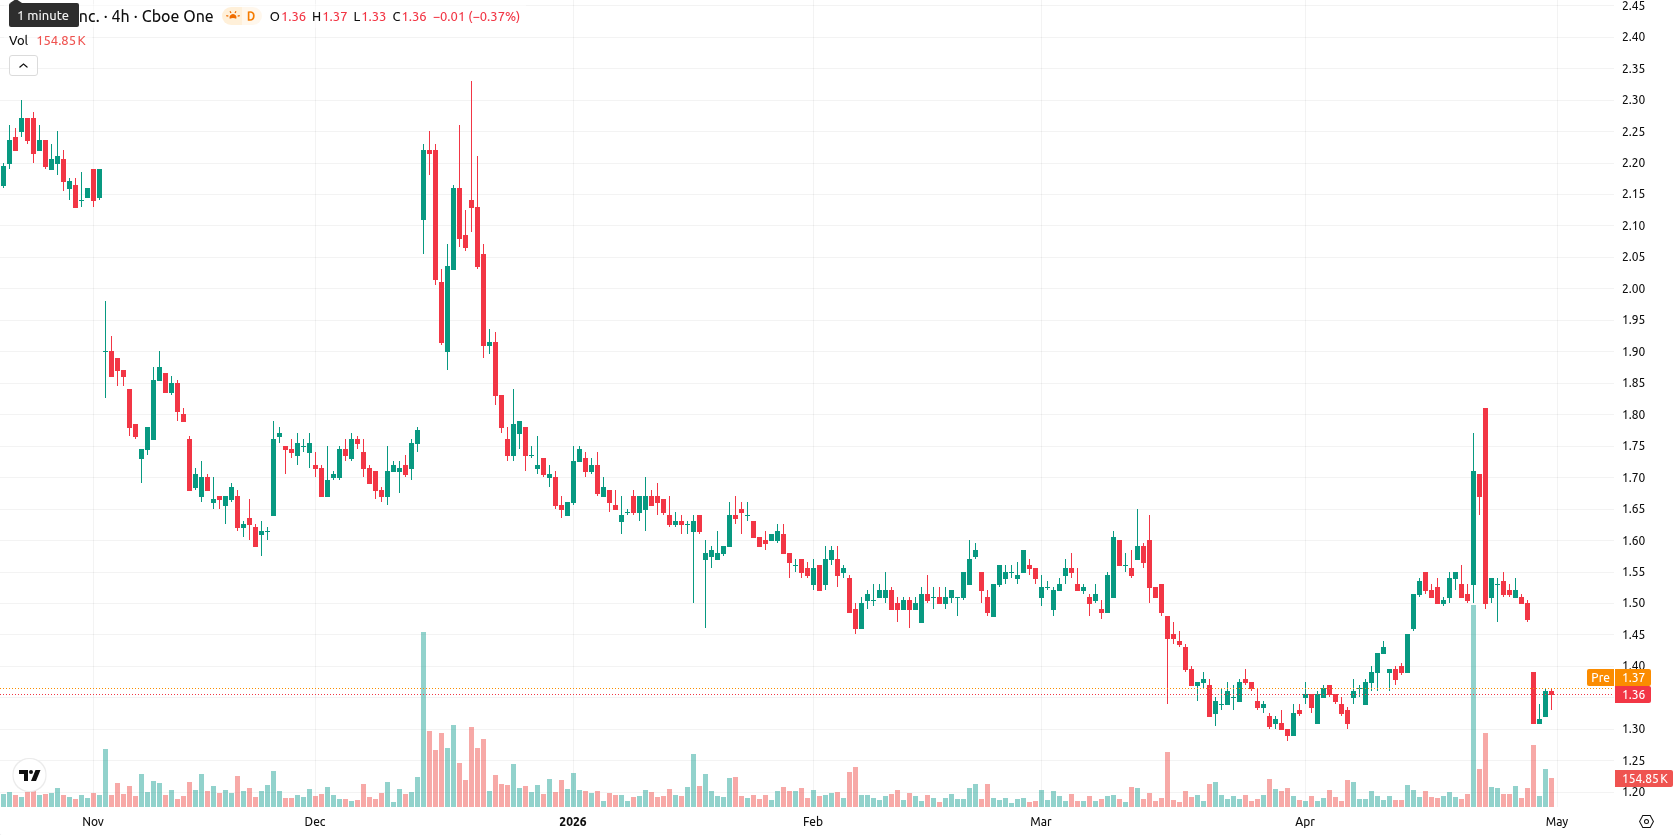
Sundial Growers Inc. (SNDL) is trading at $1.36 after a daily gain of 2.65%. The price remains below its key moving averages, pointing to persistent downward pressure in the short, medium, and long term.
Highlights
- SNDL is under sustained bearish pressure, trading below short-, medium-, and long-term moving averages.
- Oscillator signals are broadly bearish and indicate the stock is oversold, despite brief intraday strength.
- Price is expected to remain rangebound between $1.32 and $1.40, with downside risk increasing if $1.32 support breaks.
Oversold signals and bearish momentum amid resistance at moving averages
On the technical front, SNDL is trading below the SMA-20 ($1.45), SMA-50 ($1.46), and SMA-200 ($1.83), with the Ichimoku Kijun on the daily chart at $1.55 providing immediate resistance overhead. Daily MACD remains neutral, while the ADX on the daily timeframe indicates a mild bullish bias. Most oscillators, including the RSI (42.59, Sell), CCI (-76.72, Sell), and Stoch RSI (10.50, Oversold), suggest oversold conditions. BBP is negative at -0.09 (Sell), indicating sellers still dominate intraday momentum. The stock opened with a small gap up and is trading near the upper end of today's $1.34–$1.37 range, with low intraday volatility and a divergence between price action and bearish oscillator signals.
Low upside odds as sideways or downward scenario prevails
For the upcoming five trading days, SNDL is likely to remain within a $1.32–$1.40 range, reflecting a typical volatility band relative to current levels. The probability of a sustained price increase is very low (less than 20%), suggesting a higher likelihood of continued sideways or downward movement. A break above the $1.55 resistance would be required to shift toward a bullish scenario, whereas a drop below $1.32 support exposes greater downside risks.
Earlier, analysts noted that Sundial Growers was facing persistent selling pressure with limited signs of technical strength despite recent gains. The latest market action and indicator readings reinforce the prevailing downward bias, making a decisive move above $1.55 the key signal for a potential reversal in sentiment.


-
 Afghanistan
-
 Albania
-
 Algeria
-
 Angola
-
 Argentina
-
 Armenia
-
 Australia
-
 Austria
-
 Azerbaijan
-
 Bahamas
-
 Bahrain
-
 Bangladesh
-
 Belarus
-
 Belgium
-
 Bolivia
-
 Botswana
-
 Brazil
-
 Brunei
-
 Bulgaria
-
 Cambodia
-
 Cameroon
-
 Canada
-
 Chile
Chile
-
 China
China
-
 Colombia
-
 Congo
Congo
-
 Costa Rica
-
 Cote d'Ivoire
-
 Croatia
-
 Cuba
Cuba
-
 Cyprus
-
 Czechia
-
 DR Congo
-
 Denmark
-
 Dominican Republic
-
 Ecuador
-
 Egypt
Egypt
-
 El Salvador
-
 Estonia
-
 Eswatini
-
 Ethiopia
-
 Finland
-
 France
-
 Georgia
-
 Germany
-
 Ghana
Ghana
-
 Greece
-
 Haiti
Haiti
-
 Hong Kong
-
 Hungary
-
 India
India
-
 Indonesia
-
 Iran, Islamic republic
-
 Iraq
Iraq
-
 Ireland
-
 Israel
-
 Italy
Italy
-
 Jamaica
-
 Japan
Japan
-
 Jordan
-
 Kazakhstan
-
 Kenya
Kenya
-
 Korea
Korea
-
 Kuwait
-
 Kyrgyzstan
-
 Laos
Laos
-
 Latvia
-
 Lebanon
-
 Lesotho
-
 Libya
Libya
-
 Lithuania
-
 Luxembourg
-
 Madagascar
-
 Malaysia
-
 Malta
Malta
-
 Mauritius
-
 Mexico
-
 Moldova
-
 Mongolia
-
 Montenegro
-
 Morocco
-
 Mozambique
-
 Myanmar
-
 Namibia
-
 Nepal
Nepal
-
 Netherlands
-
 New Zealand
-
 Nigeria
-
 North Macedonia
-
 Norway
-
 Oman
Oman
-
 Pakistan
-
 Palestine
-
 Panama
-
 Papua New Guinea
-
 Paraguay
-
 Peru
Peru
-
 Philippines
-
 Poland
-
 Portugal
-
 Puerto Rico
-
 Qatar
Qatar
-
 Reunion
-
 Romania
-
 Rwanda
-
 Saudi Arabia
-
 Serbia
-
 Singapore
-
 Slovakia
-
 Slovenia
-
 Somalia
-
 South Africa
-
 Spain
Spain
-
 Sri Lanka
-
 Sweden
-
 Switzerland
-
 Syria
Syria
-
 Taiwan
-
 Tajikistan
-
 Tanzania
-
 Thailand
-
 Trinidad and Tobago
-
 Tunisia
-
 Turkey
-
 UAE
UAE
-
 Uganda
-
 Ukraine
-
 United Kingdom
-
United States
-
 Uruguay
-
 Uzbekistan
-
 Venezuela
-
 Vietnam
-
 Yemen
Yemen
-
 Zambia
-
 Zimbabwe
- Forex
- Crypto
