

-3.59% for AMD stock as broad uptrend diverges from short-term exhaustion

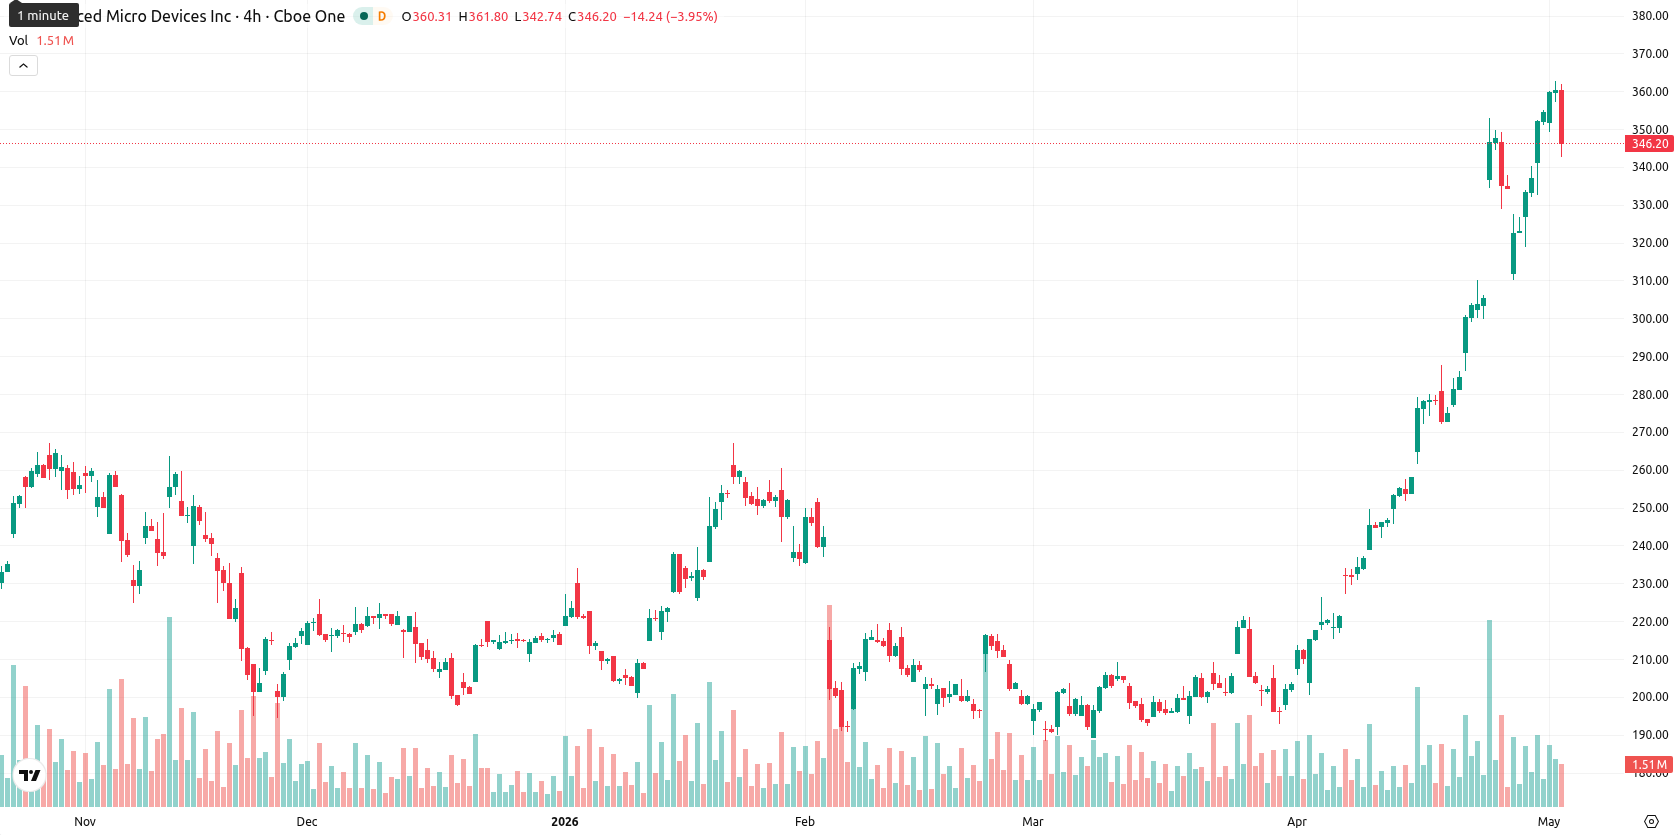
Advanced Micro Devices, Inc. (AMD) is trading at $347.69, down 3.59% for the day, and sits well above its key moving averages, indicating ongoing strength across multiple timeframes.
 598.35
658.44
598.35
658.44
Highlights
- AMD maintains a strong bullish trend with price significantly above key moving averages across all timeframes.
- Short-term momentum remains positive overall, but overbought indicators and intraday weakness warn of potential exhaustion.
- Forecast for the next five sessions sees AMD oscillating between support at $330 and resistance at $370, with bullish momentum dominating.
Bullish momentum diverges from near-term exhaustion at support levels
The price of AMD remains significantly above the SMA-20 ($284.91), SMA-50 ($235.39), and SMA-200 ($211.38). The Ichimoku Kijun on the daily chart sits at $277.81, currently forming immediate support. AMD opened with a moderate downward gap from the previous close ($360.62 to $354.50) and is trading near the bottom of the intraday range ($342.71–$354.74), reflecting elevated volatility and ongoing downward pressure after the open. Momentum indicators such as MACD and ADX continue showing broad bullish signals, while oscillators like RSI and CCI persist in overbought territory. Stoch RSI has shifted to a sell signal, and BBP notes strong buyer dominance, but the Awesome Oscillator is reading neutral, emphasizing divergence between trend strength and short-term exhaustion.
Upward bias persists despite bounded range and pullback risks
Over the next five sessions, AMD is expected to trade within a price range of $330 to $370, aligning with typical volatility observed in high-profile equities at current levels. Weekly MACD, RSI, ADX, and the MA-50 all register unanimous bullish readings, suggesting an over 80% probability for further price appreciation, with the likelihood of a major decline currently low. The baseline scenario anticipates sideways trading bounded by support and resistance. However, a move above $370 could pave the way for a retest of recent highs, while a sustained drop below $330 would likely trigger a deeper pullback toward the next lower support zone.
Earlier, analysts noted that AMD maintained strong bullish momentum, though caution was advised due to overbought conditions and heightened volatility. The current technical setup reinforces this cautiously optimistic outlook, with traders advised to monitor for a breakout above $370 as a potential catalyst for renewed upside.











-
 Afghanistan
-
 Albania
-
 Algeria
-
 Angola
-
 Argentina
-
 Armenia
-
 Australia
-
 Austria
-
 Azerbaijan
-
 Bahamas
-
 Bahrain
-
 Bangladesh
-
 Belarus
-
 Belgium
-
 Bolivia
-
 Botswana
-
 Brazil
-
 Brunei
-
 Bulgaria
-
 Cambodia
-
 Cameroon
-
 Canada
-
 Chile
Chile
-
 China
China
-
 Colombia
-
 Congo
Congo
-
 Costa Rica
-
 Cote d'Ivoire
-
 Croatia
-
 Cuba
Cuba
-
 Cyprus
-
 Czechia
-
 DR Congo
-
 Denmark
-
 Dominican Republic
-
 Ecuador
-
 Egypt
Egypt
-
 El Salvador
-
 Estonia
-
 Eswatini
-
 Ethiopia
-
 Finland
-
 France
-
 Georgia
-
 Germany
-
 Ghana
Ghana
-
 Greece
-
 Haiti
Haiti
-
 Hong Kong
-
 Hungary
-
 India
India
-
 Indonesia
-
 Iran, Islamic republic
-
 Iraq
Iraq
-
 Ireland
-
 Israel
-
 Italy
Italy
-
 Jamaica
-
 Japan
Japan
-
 Jordan
-
 Kazakhstan
-
 Kenya
Kenya
-
 Korea
Korea
-
 Kuwait
-
 Kyrgyzstan
-
 Laos
Laos
-
 Latvia
-
 Lebanon
-
 Lesotho
-
 Libya
Libya
-
 Lithuania
-
 Luxembourg
-
 Madagascar
-
 Malaysia
-
 Malta
Malta
-
 Mauritius
-
 Mexico
-
 Moldova
-
 Mongolia
-
 Montenegro
-
 Morocco
-
 Mozambique
-
 Myanmar
-
 Namibia
-
 Nepal
Nepal
-
 Netherlands
-
 New Zealand
-
 Nigeria
-
 North Macedonia
-
 Norway
-
 Oman
Oman
-
 Pakistan
-
 Palestine
-
 Panama
-
 Papua New Guinea
-
 Paraguay
-
 Peru
Peru
-
 Philippines
-
 Poland
-
 Portugal
-
 Puerto Rico
-
 Qatar
Qatar
-
 Reunion
-
 Romania
-
 Rwanda
-
 Saudi Arabia
-
 Serbia
-
 Singapore
-
 Slovakia
-
 Slovenia
-
 Somalia
-
 South Africa
-
 Spain
Spain
-
 Sri Lanka
-
 Sweden
-
 Switzerland
-
 Syria
Syria
-
 Taiwan
-
 Tajikistan
-
 Tanzania
-
 Thailand
-
 Trinidad and Tobago
-
 Tunisia
-
 Turkey
-
 UAE
UAE
-
 Uganda
-
 Ukraine
-
 United Kingdom
-
United States
-
 Uruguay
-
 Uzbekistan
-
 Venezuela
-
 Vietnam
-
 Yemen
Yemen
-
 Zambia
-
 Zimbabwe
- Forex
- Crypto












