

AMD stock extends losses as selling pressure intensifies and bearish momentum dominates

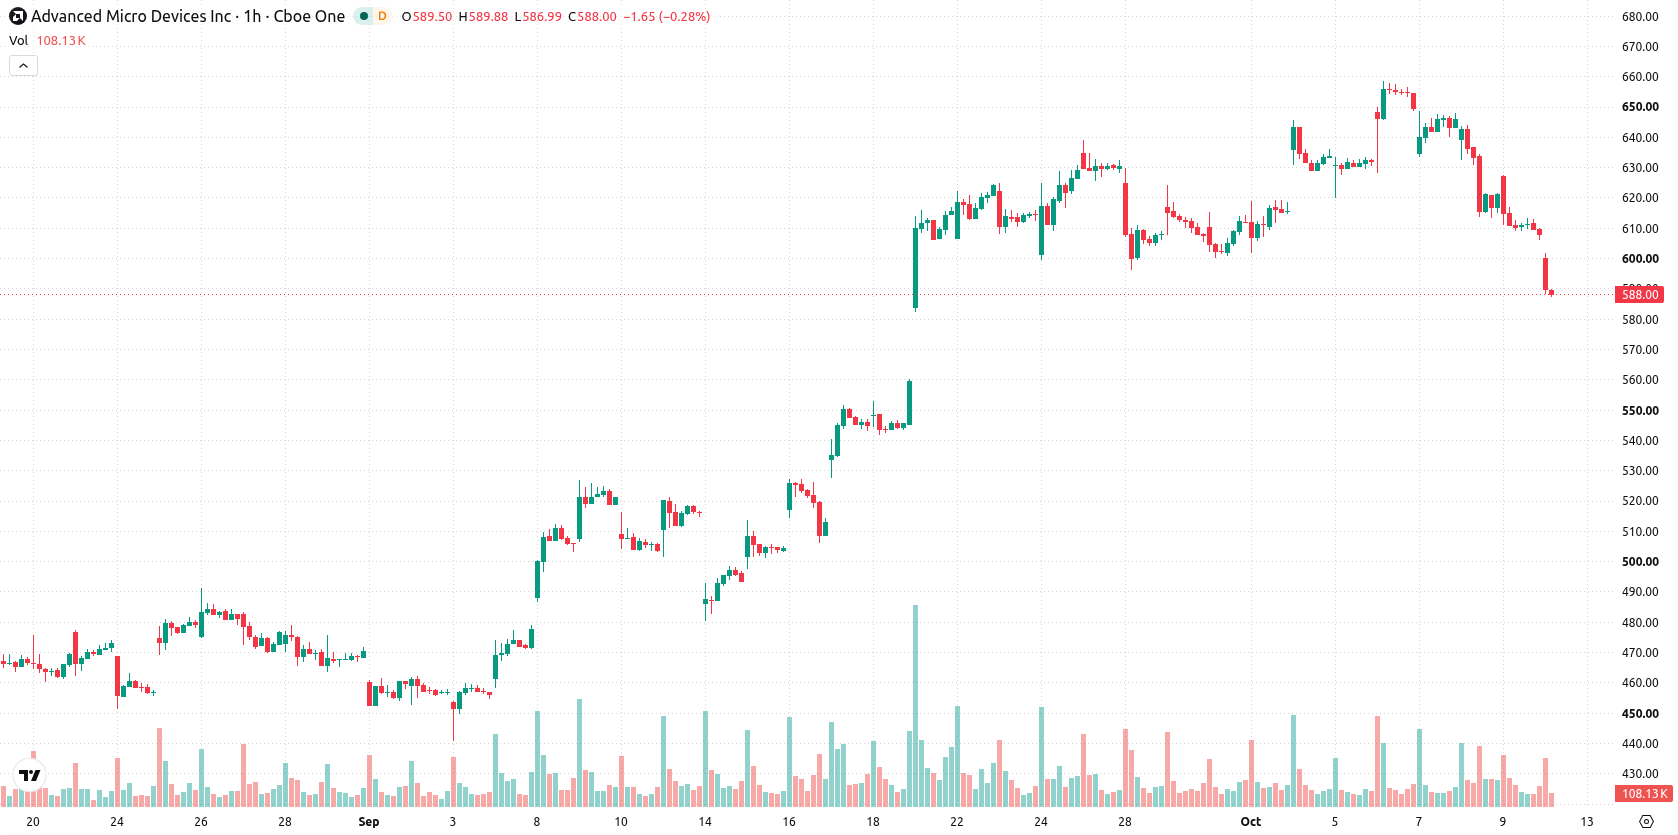
Apple Inc. (AMD) stock is trading at $587.84, marking a decline of 3.32% for the day. The price sits below its short- and medium-term moving averages but remains above its longer-term trend indicators.
 598.35
658.44
598.35
658.44
Highlights
- AMD stock closed at $587.84, falling 3.32% on the day and ending near its session low with moderate volatility.
- Bearish momentum dominates as the stock trades below short- and medium-term moving averages, with all key indicators in oversold territory and sellers controlling direction.
- Near-term, AMD is expected to remain in a $564.52 to $611.16 range with a 78% likelihood of further downside unless it reclaims resistance above $631.88.
Bearish momentum intensifies amid resistance and oversold indicators
On the technical front, AMD is currently trading below its MA-20 ($626.44) and MA-50 ($631.73) on the hourly chart, while it stays above the MA-200 ($385.3) on the daily chart. The Ichimoku Kijun level at $631.88 is acting as immediate resistance. Momentum indicators are bearish: MACD, ADX, and Awesome Oscillator all indicate selling pressure. RSI is at 31.27, with Stoch RSI confirming oversold conditions and CCI signaling a sell. Negative Bull/Bear Power suggests sellers remain in control, and no bullish divergences are visible.
Downside risk dominates as breakout probability remains limited
In the short term, AMD is projected to move within a $564.52 to $611.16 volatility band over the next few days. The probability of an upward breakout is low at 22%, with a stronger likelihood (78%) of downward continuation. If AMD remains in this range, price action should stabilize sideways. A bullish reversal scenario would require a move above the $631.88 resistance, while a drop below $564.52 could accelerate the decline.
Previously it was reported that significant investments and facility expansions in Malaysia's semiconductor sector are underway, with companies like AMD benefitting from advanced manufacturing capabilities. With AMD's shares now exhibiting strong downward momentum and limited prospects for a near-term reversal, traders should closely monitor the $564.52 level as a potential trigger for further downside risk.











-
 Afghanistan
-
 Albania
-
 Algeria
-
 Angola
-
 Argentina
-
 Armenia
-
 Australia
-
 Austria
-
 Azerbaijan
-
 Bahamas
-
 Bahrain
-
 Bangladesh
-
 Belarus
-
 Belgium
-
 Bolivia
-
 Botswana
-
 Brazil
-
 Brunei
-
 Bulgaria
-
 Cambodia
-
 Cameroon
-
 Canada
-
 Chile
Chile
-
 China
China
-
 Colombia
-
 Congo
Congo
-
 Costa Rica
-
 Cote d'Ivoire
-
 Croatia
-
 Cuba
Cuba
-
 Cyprus
-
 Czechia
-
 DR Congo
-
 Denmark
-
 Dominican Republic
-
 Ecuador
-
 Egypt
Egypt
-
 El Salvador
-
 Estonia
-
 Eswatini
-
 Ethiopia
-
 Finland
-
 France
-
 Georgia
-
 Germany
-
 Ghana
Ghana
-
 Greece
-
 Haiti
Haiti
-
 Hong Kong
-
 Hungary
-
 India
India
-
 Indonesia
-
 Iran, Islamic republic
-
 Iraq
Iraq
-
 Ireland
-
 Israel
-
 Italy
Italy
-
 Jamaica
-
 Japan
Japan
-
 Jordan
-
 Kazakhstan
-
 Kenya
Kenya
-
 Korea
Korea
-
 Kuwait
-
 Kyrgyzstan
-
 Laos
Laos
-
 Latvia
-
 Lebanon
-
 Lesotho
-
 Libya
Libya
-
 Lithuania
-
 Luxembourg
-
 Madagascar
-
 Malaysia
-
 Malta
Malta
-
 Mauritius
-
 Mexico
-
 Moldova
-
 Mongolia
-
 Montenegro
-
 Morocco
-
 Mozambique
-
 Myanmar
-
 Namibia
-
 Nepal
Nepal
-
 Netherlands
-
 New Zealand
-
 Nigeria
-
 North Macedonia
-
 Norway
-
 Oman
Oman
-
 Pakistan
-
 Palestine
-
 Panama
-
 Papua New Guinea
-
 Paraguay
-
 Peru
Peru
-
 Philippines
-
 Poland
-
 Portugal
-
 Puerto Rico
-
 Qatar
Qatar
-
 Reunion
-
 Romania
-
 Rwanda
-
 Saudi Arabia
-
 Serbia
-
 Singapore
-
 Slovakia
-
 Slovenia
-
 Somalia
-
 South Africa
-
 Spain
Spain
-
 Sri Lanka
-
 Sweden
-
 Switzerland
-
 Syria
Syria
-
 Taiwan
-
 Tajikistan
-
 Tanzania
-
 Thailand
-
 Trinidad and Tobago
-
 Tunisia
-
 Turkey
-
 UAE
UAE
-
 Uganda
-
 Ukraine
-
 United Kingdom
-
United States
-
 Uruguay
-
 Uzbekistan
-
 Venezuela
-
 Vietnam
-
 Yemen
Yemen
-
 Zambia
-
 Zimbabwe
- Forex
- Crypto












