
+1.42% for Sundial Growers stock as market stays in a narrow range

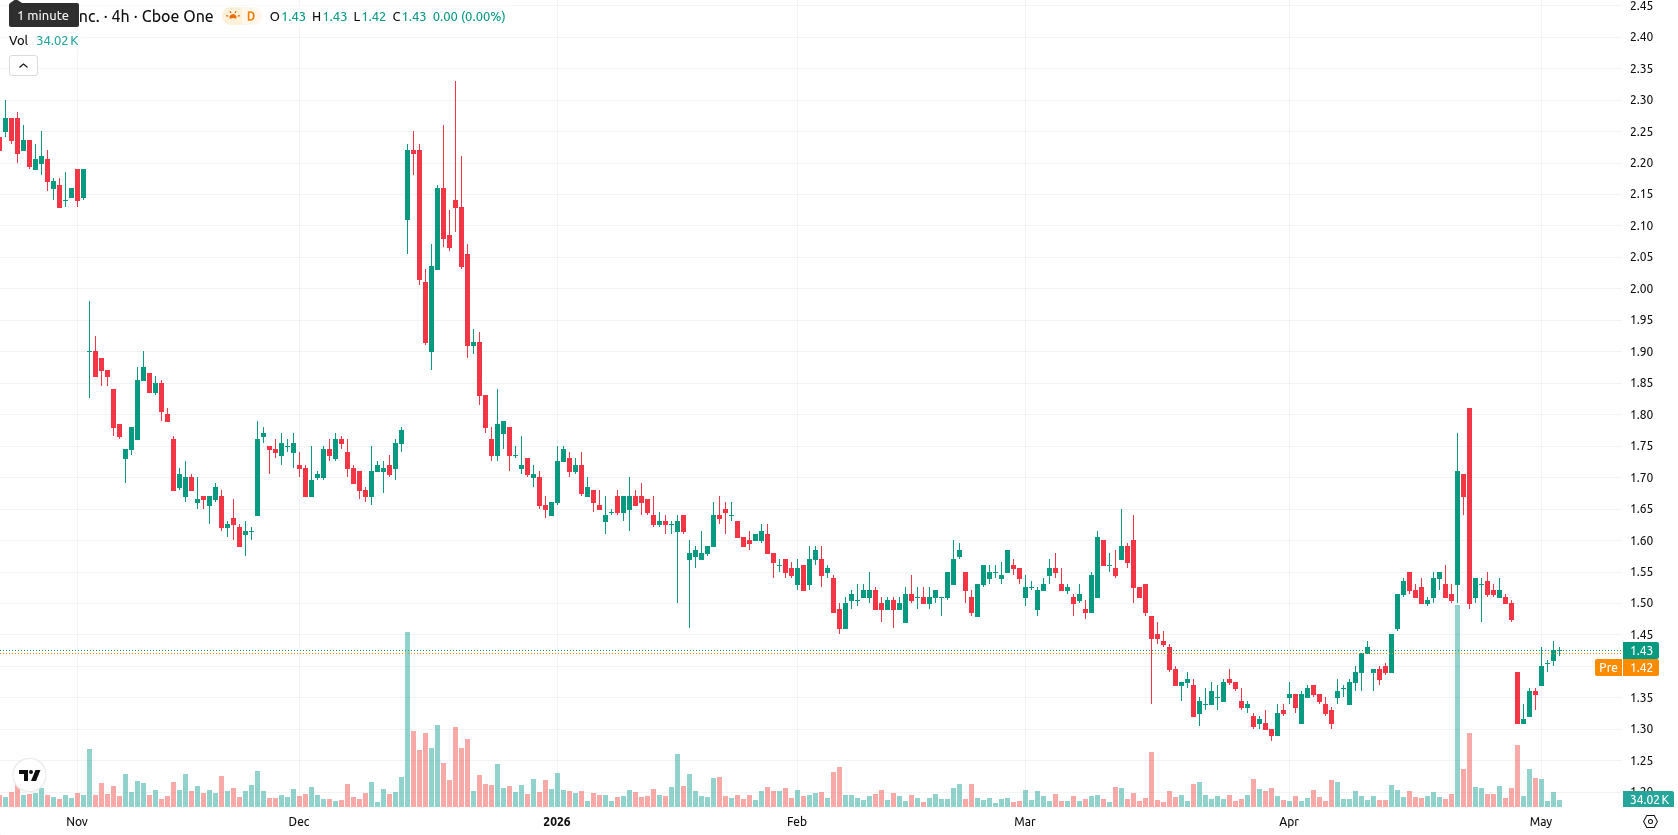
Sundial Growers Inc. (SNDL) is trading at $1.43, posting a 1.42% gain for the session. The price remains below its key moving averages, highlighting ongoing selling pressure across both short- and long-term timeframes.
Highlights
- SNDL is exhibiting persistent selling pressure, trading consistently below key short-, medium-, and long-term moving averages.
- Momentum and oscillator signals remain mixed to bearish, with sellers retaining the upper hand on intraday moves.
- For the coming week, SNDL is likely to trade sideways within a $1.41–$1.49 range, with downside risk prevailing unless price breaks above immediate resistance.
Bearish pressure endures amid mixed signals and narrow trading range
On the technical front, SNDL is trading below the MA-20 ($1.45), MA-50 ($1.45), and MA-200 ($1.83) levels. The Ichimoku Kijun on the daily chart sits at $1.55, acting as immediate resistance. Momentum signals are mixed: the MACD is neutral, the ADX on the daily chart prints 22.22 indicating weak but emerging trend strength, while the RSI stands at 48.32 with a Sell signal. Stoch RSI is neutral, CCI is slightly negative, and the Bull/Bear Power (BBP) is negative, also giving a Sell signal. The Awesome Oscillator (AO) aligns with a bearish bias, pointing to continued selling dominance intraday. After opening nearly flat at $1.42 versus the previous close of $1.41, SNDL moved toward the session high of $1.44, displaying mild intraday strength in a narrow range with low volatility. Conflicting momentum and oscillator readings indicate a lack of strong directional conviction despite recent price advances.
Sideways trade likely as upside remains capped by resistance
Looking ahead, SNDL is likely to trade within a $1.41 to $1.49 band in the coming week, representing a typical volatility band relative to current levels. The probability of a rise above the current range is low (below 20%), with prevailing technical signals favoring further weakness unless $1.49 and the Kijun resistance are decisively broken to the upside. If SNDL falls below $1.41, downside momentum is expected to intensify. The most probable scenario is sideways action within this corridor given the current mix of intraday strength and broader selling signals.
Earlier, analysts noted that Sundial Growers was facing persistent downside pressure with limited technical strength visible. Current indicators not only reaffirm this cautious stance but also highlight that a decisive move through $1.49 remains the pivotal signal for any potential shift away from the prevailing weakness.


-
 Afghanistan
-
 Albania
-
 Algeria
-
 Angola
-
 Argentina
-
 Armenia
-
 Australia
-
 Austria
-
 Azerbaijan
-
 Bahamas
-
 Bahrain
-
 Bangladesh
-
 Belarus
-
 Belgium
-
 Bolivia
-
 Botswana
-
 Brazil
-
 Brunei
-
 Bulgaria
-
 Cambodia
-
 Cameroon
-
 Canada
-
 Chile
Chile
-
 China
China
-
 Colombia
-
 Congo
Congo
-
 Costa Rica
-
 Cote d'Ivoire
-
 Croatia
-
 Cuba
Cuba
-
 Cyprus
-
 Czechia
-
 DR Congo
-
 Denmark
-
 Dominican Republic
-
 Ecuador
-
 Egypt
Egypt
-
 El Salvador
-
 Estonia
-
 Eswatini
-
 Ethiopia
-
 Finland
-
 France
-
 Georgia
-
 Germany
-
 Ghana
Ghana
-
 Greece
-
 Haiti
Haiti
-
 Hong Kong
-
 Hungary
-
 India
India
-
 Indonesia
-
 Iran, Islamic republic
-
 Iraq
Iraq
-
 Ireland
-
 Israel
-
 Italy
Italy
-
 Jamaica
-
 Japan
Japan
-
 Jordan
-
 Kazakhstan
-
 Kenya
Kenya
-
 Korea
Korea
-
 Kuwait
-
 Kyrgyzstan
-
 Laos
Laos
-
 Latvia
-
 Lebanon
-
 Lesotho
-
 Libya
Libya
-
 Lithuania
-
 Luxembourg
-
 Madagascar
-
 Malaysia
-
 Malta
Malta
-
 Mauritius
-
 Mexico
-
 Moldova
-
 Mongolia
-
 Montenegro
-
 Morocco
-
 Mozambique
-
 Myanmar
-
 Namibia
-
 Nepal
Nepal
-
 Netherlands
-
 New Zealand
-
 Nigeria
-
 North Macedonia
-
 Norway
-
 Oman
Oman
-
 Pakistan
-
 Palestine
-
 Panama
-
 Papua New Guinea
-
 Paraguay
-
 Peru
Peru
-
 Philippines
-
 Poland
-
 Portugal
-
 Puerto Rico
-
 Qatar
Qatar
-
 Reunion
-
 Romania
-
 Rwanda
-
 Saudi Arabia
-
 Serbia
-
 Singapore
-
 Slovakia
-
 Slovenia
-
 Somalia
-
 South Africa
-
 Spain
Spain
-
 Sri Lanka
-
 Sweden
-
 Switzerland
-
 Syria
Syria
-
 Taiwan
-
 Tajikistan
-
 Tanzania
-
 Thailand
-
 Trinidad and Tobago
-
 Tunisia
-
 Turkey
-
 UAE
UAE
-
 Uganda
-
 Ukraine
-
 United Kingdom
-
United States
-
 Uruguay
-
 Uzbekistan
-
 Venezuela
-
 Vietnam
-
 Yemen
Yemen
-
 Zambia
-
 Zimbabwe
- Forex
- Crypto
