
Flat trading for Meta stock as full-year capital expenditure raised to $125–$145B

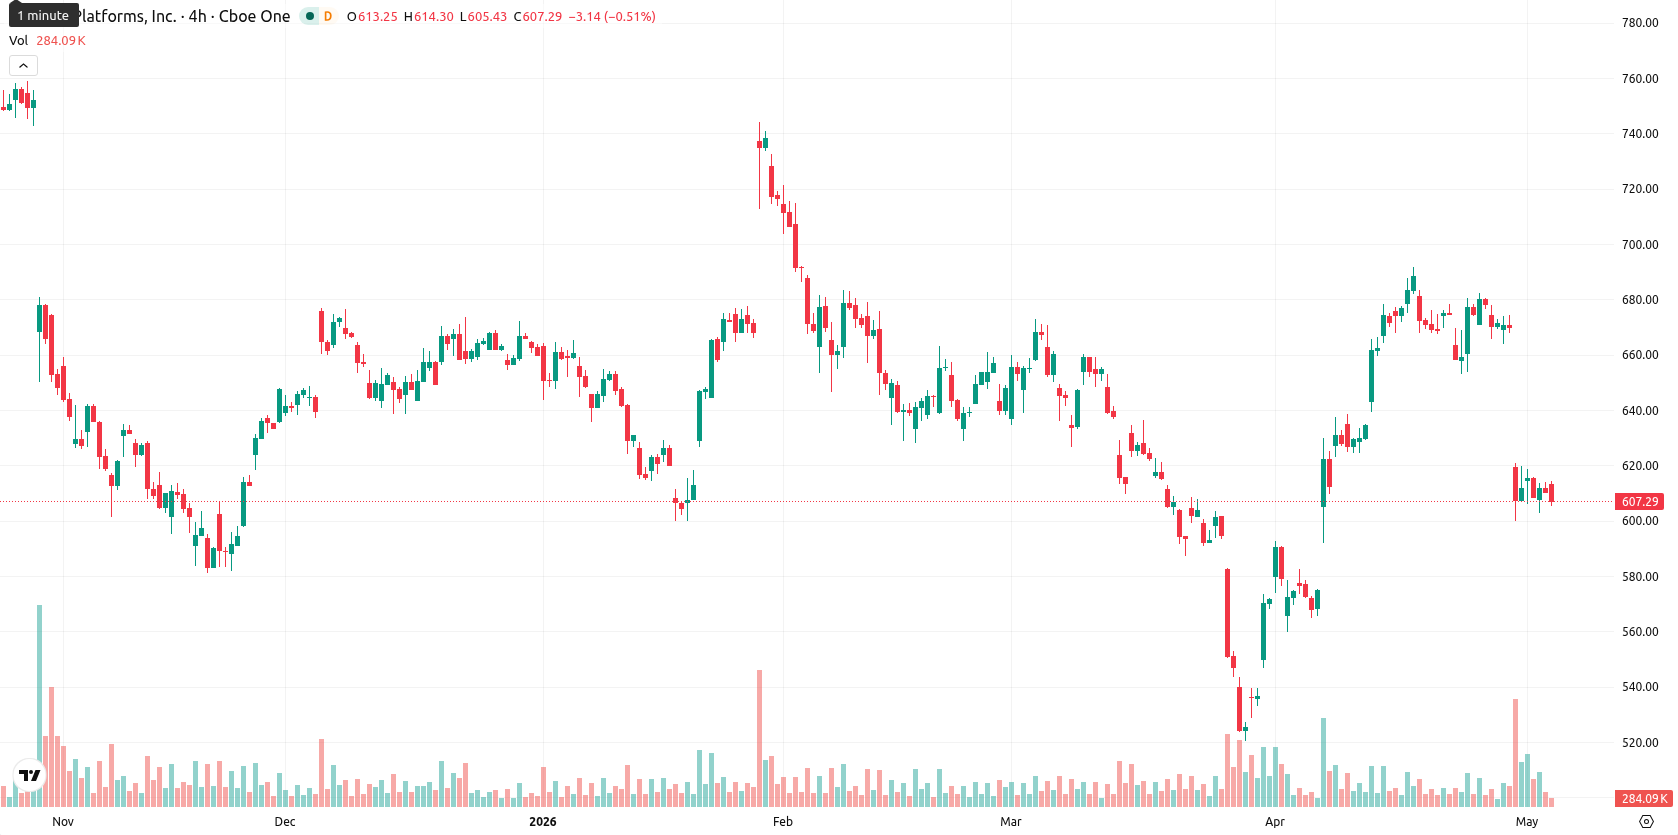
Meta Platforms, Inc. (META, formerly Facebook) is trading at $605.12, down 0.80% on the day. The price is below its key moving averages, indicating sustained downside pressure at current levels.
Highlights
- Meta secured $13 billion in debt financing for a new AI data center, significantly increasing leverage and infrastructure investment.
- Q1 2026 adjusted EPS of $7.31 exceeded forecasts, but headcount will be cut by 10% amid ongoing AI-related restructuring.
- Meta trades below major moving averages, with oscillators oversold and price likely to remain range-bound between $595 and $615 amid persistent bearish sentiment.
Increased leverage and job cuts as AI investment accelerates
On May 4, 2026, Meta secured a $13 billion financing package from Morgan Stanley and JPMorgan Chase to fund the development of a new AI data center in El Paso, Texas, with most capital raised through debt, expanding future leverage and committing significant funds toward AI infrastructure. The company also reported Q1 2026 diluted EPS of $10.44, which included an $8.03 billion one-time tax benefit, and adjusted EPS of $7.31 that surpassed consensus forecasts. In addition, Meta raised its full-year 2026 capital expenditure guidance to $125–$145 billion and announced a 10% workforce reduction involving approximately 8,000 jobs, indicating ongoing restructuring and increased investment focus in AI, though price action has remained under broader selling pressure.
All averages breached as oversold momentum counters buy signals
SMA-20 is at $648.91, SMA-50 at $629.39, and SMA-200 at $677.83, with Meta currently trading below all three levels. The Ichimoku Kijun on the daily timeframe is positioned at $605.99, providing immediate resistance just above the current price. Among momentum indicators, MACD on D1 issues a Strong Buy signal, while ADX reads 15.57, reflecting a weak and trendless environment. Oversold readings are present in RSI (41.04), CCI (-93.24), and Stoch RSI (0.97), and BBP is deeply negative at -28.22, confirming ongoing seller dominance. The Awesome Oscillator remains neutral, offering little confirmation to prevailing trends.
Consolidation risk persists as breakout odds remain limited
For the next five trading days, the expected volatility band is in the $595–$615 range. The likelihood of an upside breakout remains low (below 20%), favoring the probability of further decline. The base case anticipates consolidation between $595 and $615. A daily close above the Kijun level at $606 could open the way for a move toward $615, while a breakdown below $595 may accelerate losses if selling intensifies.
Earlier, analysts noted that Meta faced continued downside pressure amid heavy capital spending, restructuring efforts, and increased external scrutiny. With Meta now leveraging substantial new financing for AI infrastructure while maintaining oversold technical readings, traders should monitor for a potential momentum shift if the price holds above the Ichimoku Kijun resistance at $606.


-
 Afghanistan
-
 Albania
-
 Algeria
-
 Angola
-
 Argentina
-
 Armenia
-
 Australia
-
 Austria
-
 Azerbaijan
-
 Bahamas
-
 Bahrain
-
 Bangladesh
-
 Belarus
-
 Belgium
-
 Bolivia
-
 Botswana
-
 Brazil
-
 Brunei
-
 Bulgaria
-
 Cambodia
-
 Cameroon
-
 Canada
-
 Chile
Chile
-
 China
China
-
 Colombia
-
 Congo
Congo
-
 Costa Rica
-
 Cote d'Ivoire
-
 Croatia
-
 Cuba
Cuba
-
 Cyprus
-
 Czechia
-
 DR Congo
-
 Denmark
-
 Dominican Republic
-
 Ecuador
-
 Egypt
Egypt
-
 El Salvador
-
 Estonia
-
 Eswatini
-
 Ethiopia
-
 Finland
-
 France
-
 Georgia
-
 Germany
-
 Ghana
Ghana
-
 Greece
-
 Haiti
Haiti
-
 Hong Kong
-
 Hungary
-
 India
India
-
 Indonesia
-
 Iran, Islamic republic
-
 Iraq
Iraq
-
 Ireland
-
 Israel
-
 Italy
Italy
-
 Jamaica
-
 Japan
Japan
-
 Jordan
-
 Kazakhstan
-
 Kenya
Kenya
-
 Korea
Korea
-
 Kuwait
-
 Kyrgyzstan
-
 Laos
Laos
-
 Latvia
-
 Lebanon
-
 Lesotho
-
 Libya
Libya
-
 Lithuania
-
 Luxembourg
-
 Madagascar
-
 Malaysia
-
 Malta
Malta
-
 Mauritius
-
 Mexico
-
 Moldova
-
 Mongolia
-
 Montenegro
-
 Morocco
-
 Mozambique
-
 Myanmar
-
 Namibia
-
 Nepal
Nepal
-
 Netherlands
-
 New Zealand
-
 Nigeria
-
 North Macedonia
-
 Norway
-
 Oman
Oman
-
 Pakistan
-
 Palestine
-
 Panama
-
 Papua New Guinea
-
 Paraguay
-
 Peru
Peru
-
 Philippines
-
 Poland
-
 Portugal
-
 Puerto Rico
-
 Qatar
Qatar
-
 Reunion
-
 Romania
-
 Rwanda
-
 Saudi Arabia
-
 Serbia
-
 Singapore
-
 Slovakia
-
 Slovenia
-
 Somalia
-
 South Africa
-
 Spain
Spain
-
 Sri Lanka
-
 Sweden
-
 Switzerland
-
 Syria
Syria
-
 Taiwan
-
 Tajikistan
-
 Tanzania
-
 Thailand
-
 Trinidad and Tobago
-
 Tunisia
-
 Turkey
-
 UAE
UAE
-
 Uganda
-
 Ukraine
-
 United Kingdom
-
United States
-
 Uruguay
-
 Uzbekistan
-
 Venezuela
-
 Vietnam
-
 Yemen
Yemen
-
 Zambia
-
 Zimbabwe
- Forex
- Crypto
