
Sundial Growers stock price forecast: $1.41–$1.47 range as SNDL trades flat

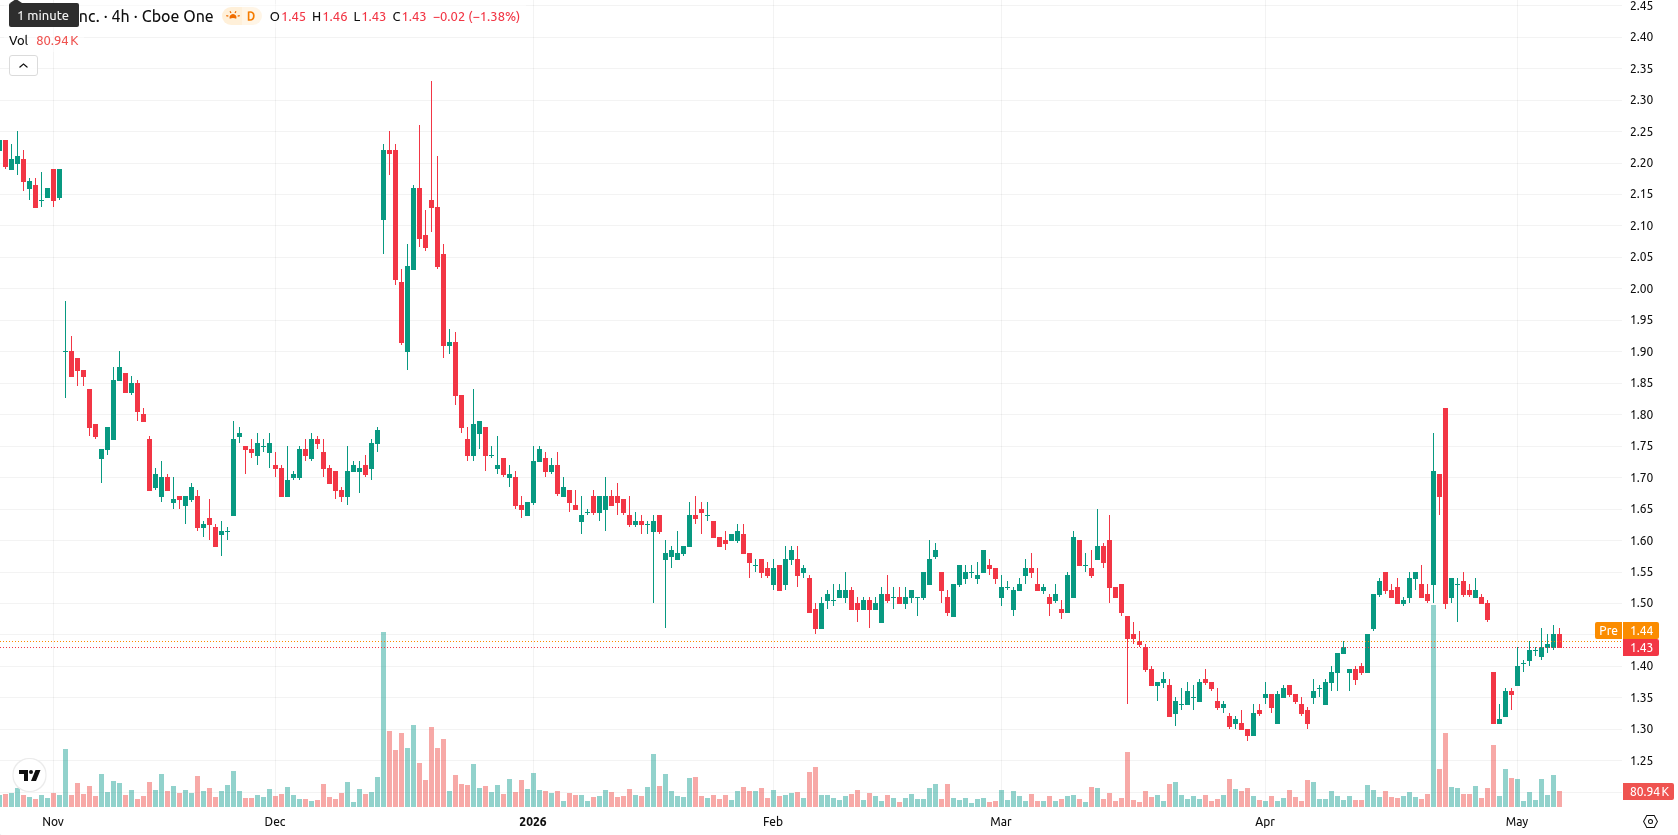
Sundial Growers Inc. (SNDL) is trading at $1.43, unchanged on the day, and remains below its key moving averages, reflecting neutral price action in the short term.
Highlights
- SNDL remains under selling pressure, trading below key moving averages across all timeframes, indicating a persistent bearish trend.
- Momentum signals are mixed and mostly neutral, with mild buying attempts offset by broader weakness and lack of clear trend strength.
- Price is expected to consolidate between $1.41 and $1.47 over the next week, with downside risk dominating and a breakout above $1.55 needed for reversal.
Bearish oscillator signals contrast with muted volatility
On the technical front, SNDL is currently below the MA-20 ($1.46), MA-50 ($1.45), and MA-200 ($1.83), while the Ichimoku Kijun level at $1.55 stands as immediate overhead resistance. On the daily timeframe, the MACD is neutral, the ADX reads 21.99 and gives a mild Buy signal, RSI is slightly bearish at 48.76, and both Stoch RSI and CCI present neutral-to-oversold conditions. BBP registers mild intraday buying activity, but daily price action is flat with no opening gap. SNDL is trading in a narrow band between $1.43 and $1.47 with low volatility; the divergence between neutral momentum readings and sustained bearish oscillator signals highlights uncertainty.
Limited upside seen as consolidation holds within tight band
In the short term, SNDL is expected to remain within a typical volatility range of $1.41 to $1.47 over the next five trading days. The probability of an upside move is low (less than 20%), which favors a continued consolidation scenario between $1.41 and $1.47. Should price break above resistance at $1.55, a bullish scenario could unfold and lead to higher levels. Alternatively, a drop below $1.41 would likely extend the prevailing downward trend.
Earlier, analysts noted that Sundial Growers was grappling with persistent technical weakness and a lack of clear bullish momentum. The current analysis reaffirms this cautious stance, with ongoing neutral-to-bearish signals suggesting that traders should monitor the $1.55 resistance as a potential pivot point for any significant shift in trend.


-
 Afghanistan
-
 Albania
-
 Algeria
-
 Angola
-
 Argentina
-
 Armenia
-
 Australia
-
 Austria
-
 Azerbaijan
-
 Bahamas
-
 Bahrain
-
 Bangladesh
-
 Belarus
-
 Belgium
-
 Bolivia
-
 Botswana
-
 Brazil
-
 Brunei
-
 Bulgaria
-
 Cambodia
-
 Cameroon
-
 Canada
-
 Chile
Chile
-
 China
China
-
 Colombia
-
 Congo
Congo
-
 Costa Rica
-
 Cote d'Ivoire
-
 Croatia
-
 Cuba
Cuba
-
 Cyprus
-
 Czechia
-
 DR Congo
-
 Denmark
-
 Dominican Republic
-
 Ecuador
-
 Egypt
Egypt
-
 El Salvador
-
 Estonia
-
 Eswatini
-
 Ethiopia
-
 Finland
-
 France
-
 Georgia
-
 Germany
-
 Ghana
Ghana
-
 Greece
-
 Haiti
Haiti
-
 Hong Kong
-
 Hungary
-
 India
India
-
 Indonesia
-
 Iran, Islamic republic
-
 Iraq
Iraq
-
 Ireland
-
 Israel
-
 Italy
Italy
-
 Jamaica
-
 Japan
Japan
-
 Jordan
-
 Kazakhstan
-
 Kenya
Kenya
-
 Korea
Korea
-
 Kuwait
-
 Kyrgyzstan
-
 Laos
Laos
-
 Latvia
-
 Lebanon
-
 Lesotho
-
 Libya
Libya
-
 Lithuania
-
 Luxembourg
-
 Madagascar
-
 Malaysia
-
 Malta
Malta
-
 Mauritius
-
 Mexico
-
 Moldova
-
 Mongolia
-
 Montenegro
-
 Morocco
-
 Mozambique
-
 Myanmar
-
 Namibia
-
 Nepal
Nepal
-
 Netherlands
-
 New Zealand
-
 Nigeria
-
 North Macedonia
-
 Norway
-
 Oman
Oman
-
 Pakistan
-
 Palestine
-
 Panama
-
 Papua New Guinea
-
 Paraguay
-
 Peru
Peru
-
 Philippines
-
 Poland
-
 Portugal
-
 Puerto Rico
-
 Qatar
Qatar
-
 Reunion
-
 Romania
-
 Rwanda
-
 Saudi Arabia
-
 Serbia
-
 Singapore
-
 Slovakia
-
 Slovenia
-
 Somalia
-
 South Africa
-
 Spain
Spain
-
 Sri Lanka
-
 Sweden
-
 Switzerland
-
 Syria
Syria
-
 Taiwan
-
 Tajikistan
-
 Tanzania
-
 Thailand
-
 Trinidad and Tobago
-
 Tunisia
-
 Turkey
-
 UAE
UAE
-
 Uganda
-
 Ukraine
-
 United Kingdom
-
United States
-
 Uruguay
-
 Uzbekistan
-
 Venezuela
-
 Vietnam
-
 Yemen
Yemen
-
 Zambia
-
 Zimbabwe
- Forex
- Crypto
