
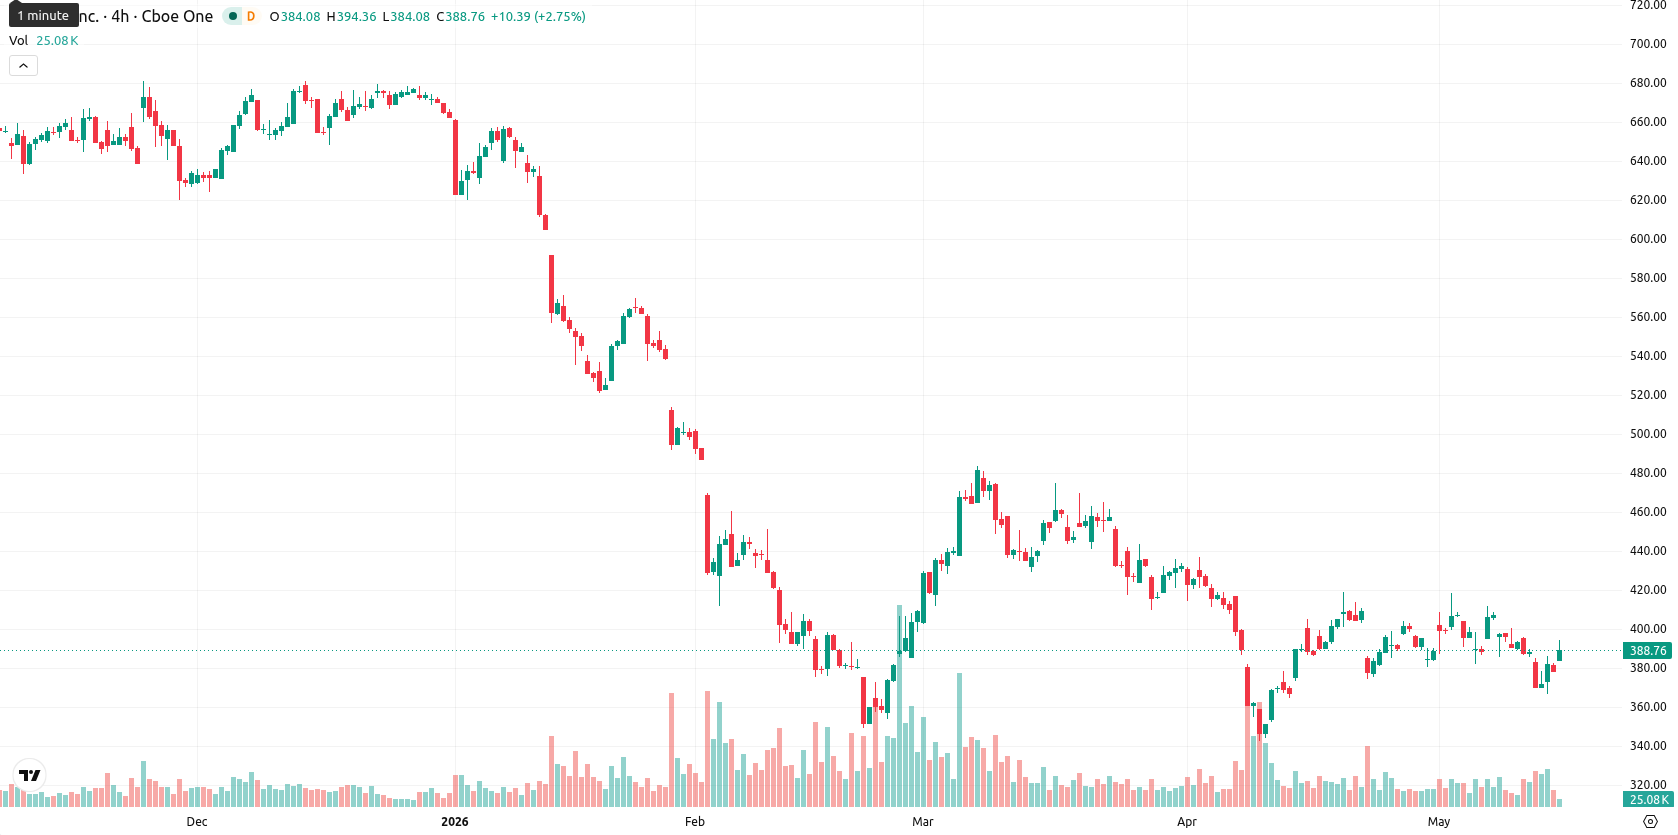
Intuit stock holds near $391 facing resistance at MA-20 of $452.25: weekly analysis

Intuit Inc. (INTU) is trading significantly below its key weekly moving averages, with the current price at $390.77, well under the MA-20 ($452.25), MA-50 ($601.72), and MA-200 ($557.47). Over the last week, INTU declined by $5.16, or 1.38%, demonstrating continued downward momentum and remaining in the upper part of a volatile weekly range.
Highlights
- Intuit is experiencing persistent selling pressure, trading well below all major weekly moving averages and failing to attract sustainable buying interest.
- Momentum indicators, including MACD, ADX, RSI, and CCI, confirm a strong bearish bias, with sellers remaining in control and no buy signals present.
- INTU is expected to trade between $366 and $408 next week, with a low probability of an upward move and increased risk of further decline if $366 breaks.
Platform expansion and AI initiatives drive sentiment shifts this week
Intuit expanded its product lineup this week with major enhancements to the Intuit Enterprise Suite platform, including the rollout of AI-powered insights, automation for intercompany accounting workflows, and new integrated human capital management features. The company also launched a specialized Construction Edition to serve industry-specific needs. In addition, Intuit entered into a partnership with Vapi to leverage voice AI tools for improved customer support and engagement while continuing to focus on their core strategy of platform integration and subscription-based services.
Bearish momentum intensifies over week amid high volatility and resistance
Technical analysis on the weekly timeframe continues to show persistent weakness for INTU. The price remains well below all significant weekly moving averages, with the nearest resistance marked by the MA-20 at $452.25. Weekly momentum indicators (MACD, ADX, RSI, Stochastic RSI, and CCI) all point solidly toward a sell scenario, confirming strong bearish control, and Bull/Bear Power supports this downside bias. Weekly volatility is high at 9.08%, with the price settling in the upper zone of its recent range.
Downside bias persists for next week as rebound likelihood remains low
Looking ahead to the next 5 trading days, INTU is expected to fluctuate within a range of $366 to $408, reflecting the prevailing bearish momentum and notable weekly volatility. There is a low probability (less than 20%) of a substantial rebound, with sideways or further downward movement most likely as none of the primary weekly indicators signal a buying opportunity. A decisive move upward would require a close above $408, while further selling could push the price below $366 if bearish momentum persists.
Earlier, analysts noted that despite Intuit's product innovation and ecosystem expansion, the stock remained under persistent selling pressure and showed a generally cautious technical outlook. The current analysis reinforces this bearish scenario, with intensified weekly weakness and limited rebound potential, making a close above $408 the key threshold to watch for signs of any trend reversal.


-
 Afghanistan
-
 Albania
-
 Algeria
-
 Angola
-
 Argentina
-
 Armenia
-
 Australia
-
 Austria
-
 Azerbaijan
-
 Bahamas
-
 Bahrain
-
 Bangladesh
-
 Belarus
-
 Belgium
-
 Bolivia
-
 Botswana
-
 Brazil
-
 Brunei
-
 Bulgaria
-
 Cambodia
-
 Cameroon
-
 Canada
-
 Chile
Chile
-
 China
China
-
 Colombia
-
 Congo
Congo
-
 Costa Rica
-
 Cote d'Ivoire
-
 Croatia
-
 Cuba
Cuba
-
 Cyprus
-
 Czechia
-
 DR Congo
-
 Denmark
-
 Dominican Republic
-
 Ecuador
-
 Egypt
Egypt
-
 El Salvador
-
 Estonia
-
 Eswatini
-
 Ethiopia
-
 Finland
-
 France
-
 Georgia
-
 Germany
-
 Ghana
Ghana
-
 Greece
-
 Haiti
Haiti
-
 Hong Kong
-
 Hungary
-
 India
India
-
 Indonesia
-
 Iran, Islamic republic
-
 Iraq
Iraq
-
 Ireland
-
 Israel
-
 Italy
Italy
-
 Jamaica
-
 Japan
Japan
-
 Jordan
-
 Kazakhstan
-
 Kenya
Kenya
-
 Korea
Korea
-
 Kuwait
-
 Kyrgyzstan
-
 Laos
Laos
-
 Latvia
-
 Lebanon
-
 Lesotho
-
 Libya
Libya
-
 Lithuania
-
 Luxembourg
-
 Madagascar
-
 Malaysia
-
 Malta
Malta
-
 Mauritius
-
 Mexico
-
 Moldova
-
 Mongolia
-
 Montenegro
-
 Morocco
-
 Mozambique
-
 Myanmar
-
 Namibia
-
 Nepal
Nepal
-
 Netherlands
-
 New Zealand
-
 Nigeria
-
 North Macedonia
-
 Norway
-
 Oman
Oman
-
 Pakistan
-
 Palestine
-
 Panama
-
 Papua New Guinea
-
 Paraguay
-
 Peru
Peru
-
 Philippines
-
 Poland
-
 Portugal
-
 Puerto Rico
-
 Qatar
Qatar
-
 Reunion
-
 Romania
-
 Rwanda
-
 Saudi Arabia
-
 Serbia
-
 Singapore
-
 Slovakia
-
 Slovenia
-
 Somalia
-
 South Africa
-
 Spain
Spain
-
 Sri Lanka
-
 Sweden
-
 Switzerland
-
 Syria
Syria
-
 Taiwan
-
 Tajikistan
-
 Tanzania
-
 Thailand
-
 Trinidad and Tobago
-
 Tunisia
-
 Turkey
-
 UAE
UAE
-
 Uganda
-
 Ukraine
-
 United Kingdom
-
United States
-
 Uruguay
-
 Uzbekistan
-
 Venezuela
-
 Vietnam
-
 Yemen
Yemen
-
 Zambia
-
 Zimbabwe
- Forex
- Crypto
