
PEP stock slides to $149.43 as sellers dominate below MA-20 and MA-200: weekly outlook

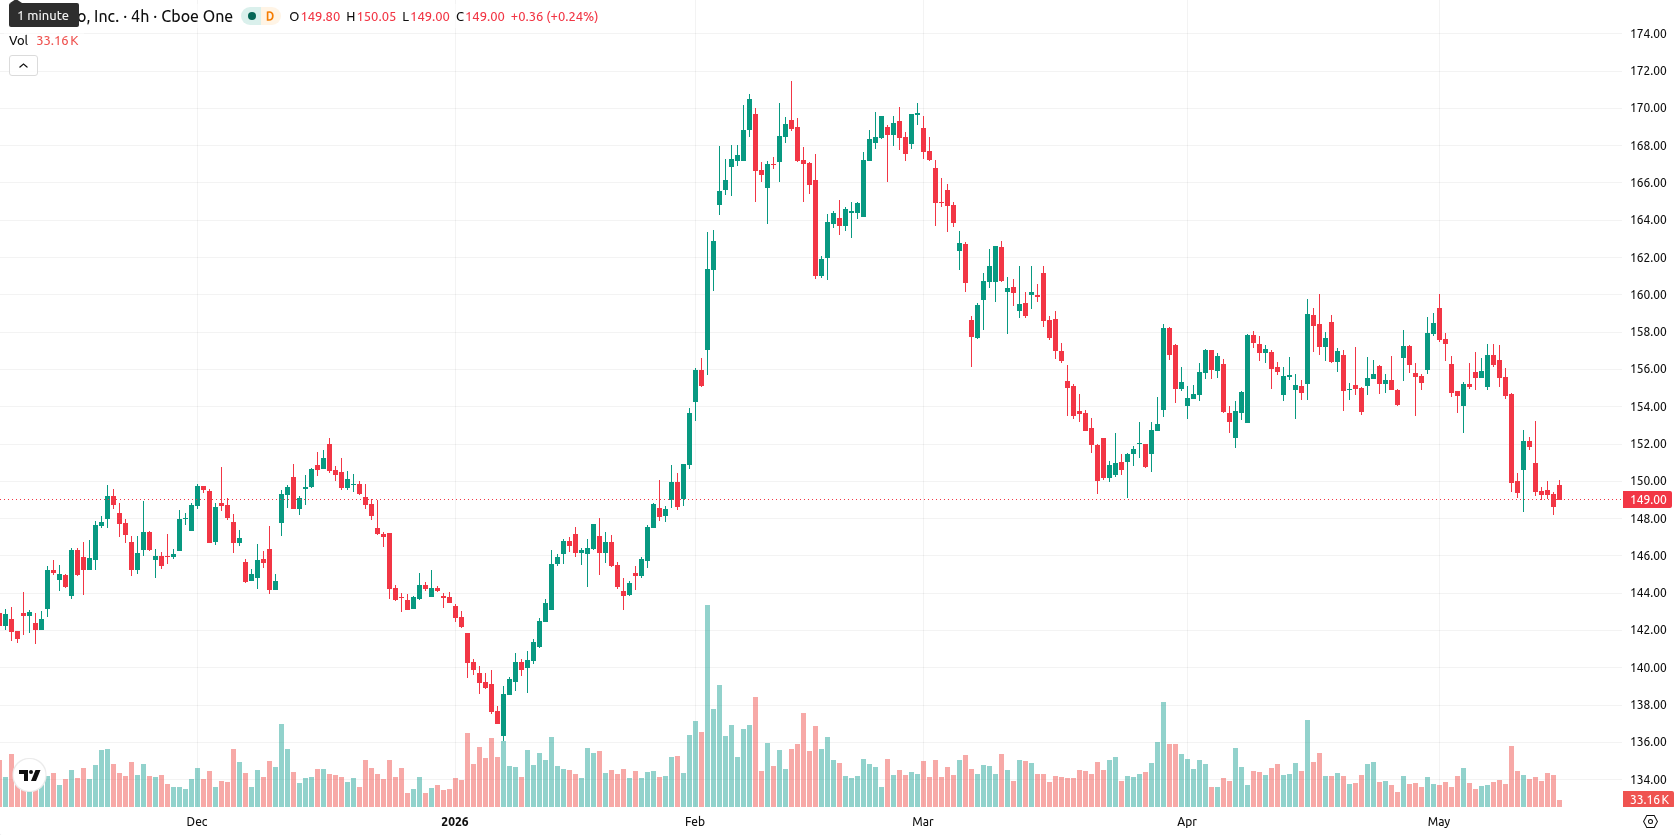
PepsiCo, Inc. (PEP) closed the week at $149.43, down $5.09, or 3.46%, over the last seven days. The stock remains below its weekly MA-20 ($155.40) and MA-200 ($163.92), but is holding slightly above the MA-50 ($148.12), with the weekly close near the bottom of its range and dynamic support at MA-50 preventing a deeper decline.
Highlights
- PepsiCo trades below key medium- and long-term moving averages, signaling sustained bearish pressure and weak technical momentum.
- Oscillators indicate the stock is oversold with short-term reversal signals emerging, but trend indicators remain weak or neutral.
- Expected price range for the week is $146.50 to $155.80, with base case calling for sideways consolidation above key support.
Earnings beat and acquisitions lift sentiment during busy corporate week
PepsiCo posted solid first-quarter results with earnings per share of $1.61 and revenue of $19.44 billion, both surpassing expectations and signaling ongoing business strength. The company’s board approved a $10 billion share repurchase program set to start in February 2026, while quarterly dividends were increased to $1.48 per share. PepsiCo also acquired Poppi, a prebiotic soda brand, for $1.95 billion and advanced its sustainability strategy through a partnership to reduce emissions in its agricultural supply chains.
Diverging momentum as oversold signals and MACD clash over the week
On the weekly (W1) technical chart, PEP remains under medium- and long-term selling pressure as prices stay below the MA-20 and MA-200, but find initial support just above the MA-50. Key resistance is set near $155.80, while support lies around $148.12 and $146.50. Weekly oscillators (RSI, Stochastic RSI, CCI) show oversold conditions, and the Bull/Bear Power indicates that sellers dominate, though the MACD signals a Strong Buy. The Awesome Oscillator is neutral, and the ADX points to weak trend strength, highlighting diverging momentum and early reversal signals.
Sideways to lower bias anticipated as consolidation tests support next week
For the next five trading days, PEP is projected to trade within a $146.50 to $155.80 range as the price consolidates near support. Baseline expectations suggest sideways movement, with a 75% probability of drifting lower or staying flat given that only the MACD signals a strong bullish case. If short-term momentum improves, the stock may attempt to approach resistance near $155.80, but if seller pressure persists, a move below $148.12 toward $146.50 is likely.
Previously it was reported that PepsiCo was exhibiting a neutral, range-bound bias as technical and fundamental signals remained mixed. With new oversold readings emerging and the price holding just above medium-term support, traders should closely monitor the $148.12 level for potential breakdown risk or confirmation of a developing reversal.


-
 Afghanistan
-
 Albania
-
 Algeria
-
 Angola
-
 Argentina
-
 Armenia
-
 Australia
-
 Austria
-
 Azerbaijan
-
 Bahamas
-
 Bahrain
-
 Bangladesh
-
 Belarus
-
 Belgium
-
 Bolivia
-
 Botswana
-
 Brazil
-
 Brunei
-
 Bulgaria
-
 Cambodia
-
 Cameroon
-
 Canada
-
 Chile
Chile
-
 China
China
-
 Colombia
-
 Congo
Congo
-
 Costa Rica
-
 Cote d'Ivoire
-
 Croatia
-
 Cuba
Cuba
-
 Cyprus
-
 Czechia
-
 DR Congo
-
 Denmark
-
 Dominican Republic
-
 Ecuador
-
 Egypt
Egypt
-
 El Salvador
-
 Estonia
-
 Eswatini
-
 Ethiopia
-
 Finland
-
 France
-
 Georgia
-
 Germany
-
 Ghana
Ghana
-
 Greece
-
 Haiti
Haiti
-
 Hong Kong
-
 Hungary
-
 India
India
-
 Indonesia
-
 Iran, Islamic republic
-
 Iraq
Iraq
-
 Ireland
-
 Israel
-
 Italy
Italy
-
 Jamaica
-
 Japan
Japan
-
 Jordan
-
 Kazakhstan
-
 Kenya
Kenya
-
 Korea
Korea
-
 Kuwait
-
 Kyrgyzstan
-
 Laos
Laos
-
 Latvia
-
 Lebanon
-
 Lesotho
-
 Libya
Libya
-
 Lithuania
-
 Luxembourg
-
 Madagascar
-
 Malaysia
-
 Malta
Malta
-
 Mauritius
-
 Mexico
-
 Moldova
-
 Mongolia
-
 Montenegro
-
 Morocco
-
 Mozambique
-
 Myanmar
-
 Namibia
-
 Nepal
Nepal
-
 Netherlands
-
 New Zealand
-
 Nigeria
-
 North Macedonia
-
 Norway
-
 Oman
Oman
-
 Pakistan
-
 Palestine
-
 Panama
-
 Papua New Guinea
-
 Paraguay
-
 Peru
Peru
-
 Philippines
-
 Poland
-
 Portugal
-
 Puerto Rico
-
 Qatar
Qatar
-
 Reunion
-
 Romania
-
 Rwanda
-
 Saudi Arabia
-
 Serbia
-
 Singapore
-
 Slovakia
-
 Slovenia
-
 Somalia
-
 South Africa
-
 Spain
Spain
-
 Sri Lanka
-
 Sweden
-
 Switzerland
-
 Syria
Syria
-
 Taiwan
-
 Tajikistan
-
 Tanzania
-
 Thailand
-
 Trinidad and Tobago
-
 Tunisia
-
 Turkey
-
 UAE
UAE
-
 Uganda
-
 Ukraine
-
 United Kingdom
-
United States
-
 Uruguay
-
 Uzbekistan
-
 Venezuela
-
 Vietnam
-
 Yemen
Yemen
-
 Zambia
-
 Zimbabwe
- Forex
- Crypto
