
PEP shares hold steady supported by medium-term trend strength: weekly analysis

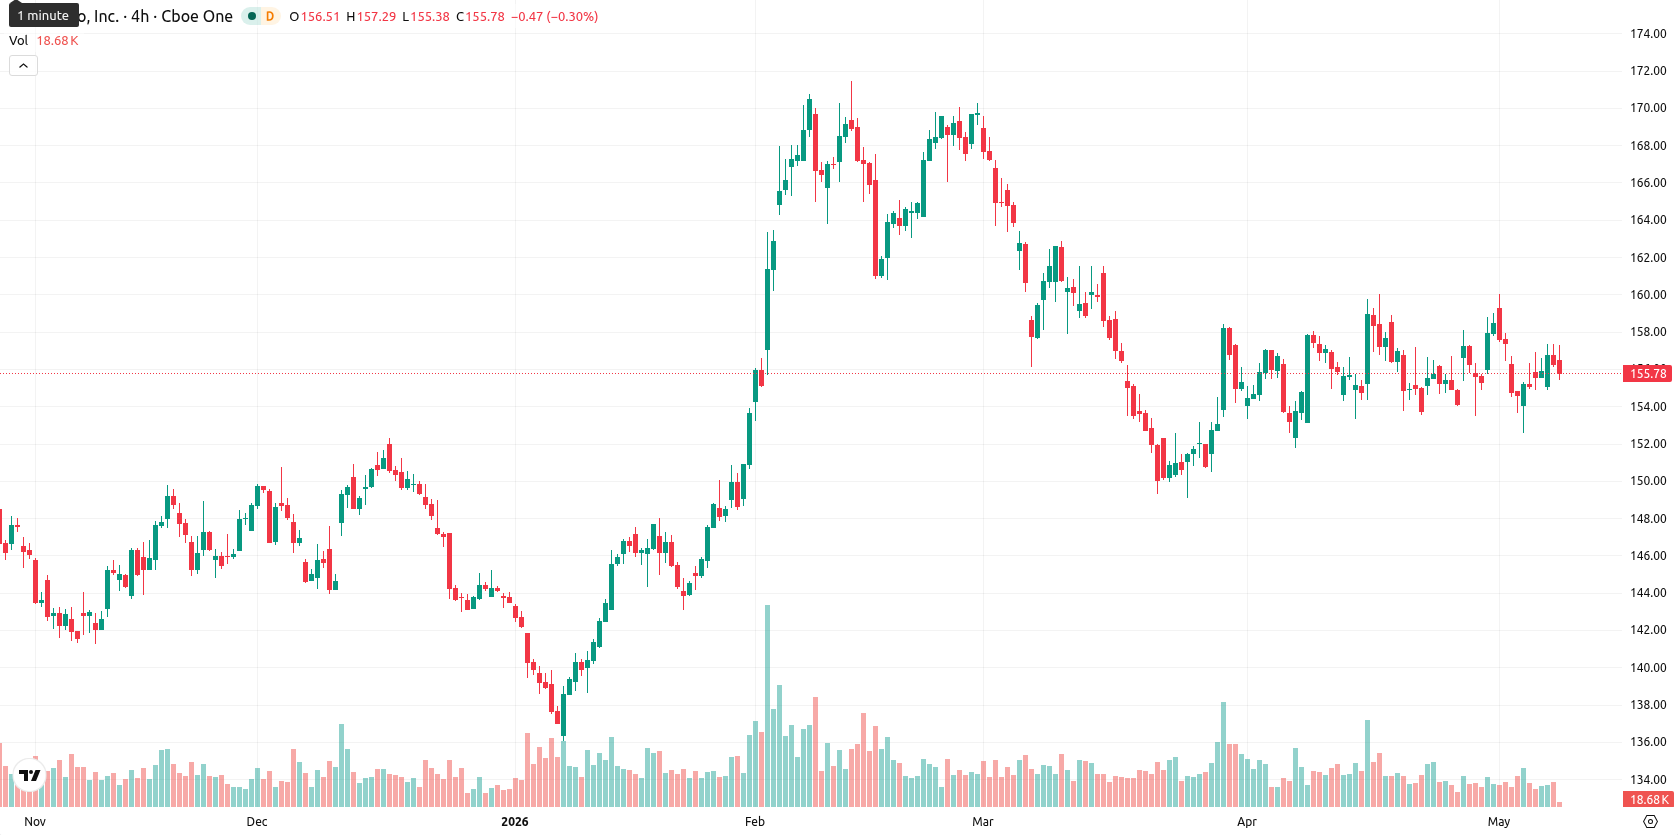
PepsiCo, Inc. (PEP) ended the week at $156.14, down $1.30 or 1.06% from the previous week, trading in the upper part of its recent weekly range. The price remains slightly above the Weekly MA-20 ($155.25), well above the MA-50 ($147.82), but below the long-term MA-200 ($164.04), indicating ongoing structural support from medium- and longer-term trends while encountering resistance at higher levels.
Highlights
- PepsiCo is consolidating recent gains and experiencing a steady pullback, trading in the upper region of its weekly range.
- Mixed momentum signals indicate internal divergence, with overbought conditions but a lack of strong trend confirmation.
- PepsiCo is projected to move sideways next week between $153.10 support and $160.90 resistance, with equal upside and downside probability.
Organic revenue gains and buyback plan buoy sentiment amid investor shifts
PepsiCo reported a 3% increase in organic revenue for the first quarter of 2026, led by international expansion and steady growth in its North American beverage and foods segments. The company approved a $10 billion share repurchase program and declared a quarterly dividend of $1.48 per share, up 4%, to be paid on June 30, 2026. Recent weeks also saw several institutional investors adjust their holdings, and PepsiCo continued to make progress in sustainability initiatives through partnerships for low-carbon fertilizer and APAC regional programs.
Mixed weekly momentum and overbought signals temper upside after recent gains
On the weekly (W1) timeframe, PepsiCo is positioned above its MA-20 and MA-50 but remains beneath the MA-200, suggesting medium-term support but ongoing long-term resistance. Weekly support is identified around $153.10, with resistance seen near $160.90 and further out at the MA-200 ($164.04). Momentum readings are mixed, as the MACD points to strong bullish momentum and the RSI stands at 52.58 (moderately bullish), while the ADX signals a neutral trend and Stochastic RSI flashes a sell signal. The Bull/Bear Power indicator remains overbought, highlighting persistent buying pressure despite a consolidative tone after recent gains.
Range-bound outlook next week as breakout hinges on momentum shift
Looking ahead, PepsiCo is expected to trade sideways over the next five trading days, consolidating between support at $153.10 and resistance at $160.90 in line with the mixed weekly momentum signals. Should bullish momentum strengthen and the price break above $160.90, a move toward the long-term MA-200 ($164.00) could develop. Conversely, a drop below $153.10 would increase downside risks and potentially retest the MA-50 near $147.82. The baseline scenario is for a range-bound week until a clear directional signal emerges from weekly indicators.
Previously it was reported that PepsiCo was exhibiting a neutral, sideways trading bias amid mixed technical and fundamental signals. The latest developments, including continued institutional activity and enhanced capital returns, further reinforce a consolidative setup, making a clear break above $160.90 or below $153.10 critical for determining the next directional move.


-
 Afghanistan
-
 Albania
-
 Algeria
-
 Angola
-
 Argentina
-
 Armenia
-
 Australia
-
 Austria
-
 Azerbaijan
-
 Bahamas
-
 Bahrain
-
 Bangladesh
-
 Belarus
-
 Belgium
-
 Bolivia
-
 Botswana
-
 Brazil
-
 Brunei
-
 Bulgaria
-
 Cambodia
-
 Cameroon
-
 Canada
-
 Chile
Chile
-
 China
China
-
 Colombia
-
 Congo
Congo
-
 Costa Rica
-
 Cote d'Ivoire
-
 Croatia
-
 Cuba
Cuba
-
 Cyprus
-
 Czechia
-
 DR Congo
-
 Denmark
-
 Dominican Republic
-
 Ecuador
-
 Egypt
Egypt
-
 El Salvador
-
 Estonia
-
 Eswatini
-
 Ethiopia
-
 Finland
-
 France
-
 Georgia
-
 Germany
-
 Ghana
Ghana
-
 Greece
-
 Haiti
Haiti
-
 Hong Kong
-
 Hungary
-
 India
India
-
 Indonesia
-
 Iran, Islamic republic
-
 Iraq
Iraq
-
 Ireland
-
 Israel
-
 Italy
Italy
-
 Jamaica
-
 Japan
Japan
-
 Jordan
-
 Kazakhstan
-
 Kenya
Kenya
-
 Korea
Korea
-
 Kuwait
-
 Kyrgyzstan
-
 Laos
Laos
-
 Latvia
-
 Lebanon
-
 Lesotho
-
 Libya
Libya
-
 Lithuania
-
 Luxembourg
-
 Madagascar
-
 Malaysia
-
 Malta
Malta
-
 Mauritius
-
 Mexico
-
 Moldova
-
 Mongolia
-
 Montenegro
-
 Morocco
-
 Mozambique
-
 Myanmar
-
 Namibia
-
 Nepal
Nepal
-
 Netherlands
-
 New Zealand
-
 Nigeria
-
 North Macedonia
-
 Norway
-
 Oman
Oman
-
 Pakistan
-
 Palestine
-
 Panama
-
 Papua New Guinea
-
 Paraguay
-
 Peru
Peru
-
 Philippines
-
 Poland
-
 Portugal
-
 Puerto Rico
-
 Qatar
Qatar
-
 Reunion
-
 Romania
-
 Rwanda
-
 Saudi Arabia
-
 Serbia
-
 Singapore
-
 Slovakia
-
 Slovenia
-
 Somalia
-
 South Africa
-
 Spain
Spain
-
 Sri Lanka
-
 Sweden
-
 Switzerland
-
 Syria
Syria
-
 Taiwan
-
 Tajikistan
-
 Tanzania
-
 Thailand
-
 Trinidad and Tobago
-
 Tunisia
-
 Turkey
-
 UAE
UAE
-
 Uganda
-
 Ukraine
-
 United Kingdom
-
United States
-
 Uruguay
-
 Uzbekistan
-
 Venezuela
-
 Vietnam
-
 Yemen
Yemen
-
 Zambia
-
 Zimbabwe
- Forex
- Crypto
