
PepsiCo shares display mixed momentum as support forms at $152.29: weekly report

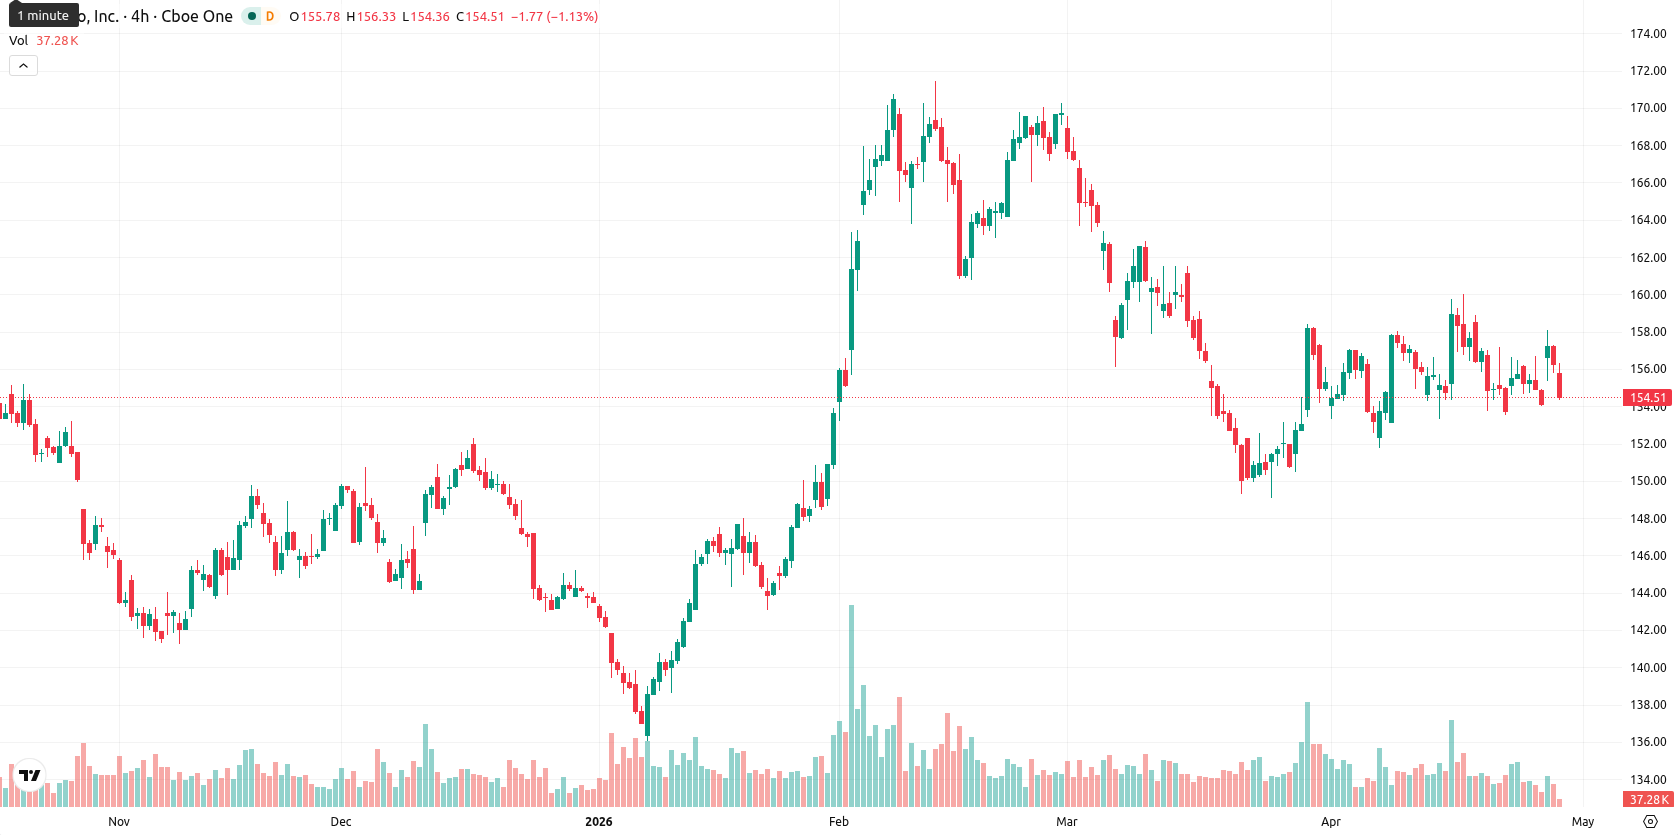
PepsiCo, Inc. (PEP) is trading at $154.39, just below the weekly MA-20 of $154.78, above the MA-50 of $147.25, and well beneath the MA-200 at $164.11. Over the past week, the stock has declined by $1.03 (0.63%), closing at the very bottom of its weekly range and showing steady downward movement amid ongoing short-term uncertainty.
Highlights
- PepsiCo is trading in a narrow range, supported above its medium-term averages, yet still facing long-term resistance overhead.
- Momentum and oscillator signals are mixed, indicating short-term market uncertainty with no clear directional strength.
- Expected weekly trading is sideways within $152.29–$156.49, with equal probability of upward or downward moves as short-term volatility persists.
Earnings growth and renewables drive sentiment amid margin pressure this week
PepsiCo signed a 10-year Virtual Power Purchase Agreement for renewable wind energy in Spain as part of its pep+ REnew program, aimed at reducing approximately 32,000 metric tons of CO₂ emissions per year in alignment with its updated 2030 climate goals. The company reported 8.5% revenue growth for Q1 2026, driven by net pricing, acquisitions, and increased food volume, with gross margin pressures from cost inflation. PepsiCo also introduced China's first Lay's Potato Restaurant in Shanghai as an experiential marketing initiative and refreshed its Mirinda branding globally. Recent regulatory filings showed notable changes in institutional shareholder positions.
Sideways bias as momentum indicators and resistance cap gains during the week
On the weekly chart, PEP remains above the medium-term MA-50 but faces resistance at the MA-200, while the current price lingers just below the MA-20. Weekly support is established near $152.29, with resistance at $156.49. The RSI on the weekly chart signals mild bullishness, but other oscillators including the ADX, Stochastic RSI, and CCI suggest a neutral market mood. The Bull/Bear Power indicator highlights overbought conditions with mixed momentum, reinforcing the sideways, uncertain technical environment.
Range-bound outlook as mixed signals limit directional conviction next week
For the next 5 trading days, PepsiCo is likely to fluctuate between $152.29 and $156.49, in line with recent weekly volatility and mixed momentum signals. The price outlook remains balanced, with roughly equal upside and downside probabilities, as only half of key indicators currently support continued buying. Baseline scenario favors sideways trading within this range. A sustained break above $156.49 would open the door to higher resistance, while a drop under $152.29 could trigger further short-term weakness.
Previously it was reported that PepsiCo's shares were exhibiting mixed technical and fundamental signals, resulting in a generally limited directional bias. Current market conditions continue to reinforce a neutral to sideways scenario, but with recent corporate developments and regulatory shifts, traders should monitor for a decisive move above $156.49 or below $152.29 as a trigger for potential breakout or breakdown momentum.


-
 Afghanistan
-
 Albania
-
 Algeria
-
 Angola
-
 Argentina
-
 Armenia
-
 Australia
-
 Austria
-
 Azerbaijan
-
 Bahamas
-
 Bahrain
-
 Bangladesh
-
 Belarus
-
 Belgium
-
 Bolivia
-
 Botswana
-
 Brazil
-
 Brunei
-
 Bulgaria
-
 Cambodia
-
 Cameroon
-
 Canada
-
 Chile
Chile
-
 China
China
-
 Colombia
-
 Congo
Congo
-
 Costa Rica
-
 Cote d'Ivoire
-
 Croatia
-
 Cuba
Cuba
-
 Cyprus
-
 Czechia
-
 DR Congo
-
 Denmark
-
 Dominican Republic
-
 Ecuador
-
 Egypt
Egypt
-
 El Salvador
-
 Estonia
-
 Eswatini
-
 Ethiopia
-
 Finland
-
 France
-
 Georgia
-
 Germany
-
 Ghana
Ghana
-
 Greece
-
 Haiti
Haiti
-
 Hong Kong
-
 Hungary
-
 India
India
-
 Indonesia
-
 Iran, Islamic republic
-
 Iraq
Iraq
-
 Ireland
-
 Israel
-
 Italy
Italy
-
 Jamaica
-
 Japan
Japan
-
 Jordan
-
 Kazakhstan
-
 Kenya
Kenya
-
 Korea
Korea
-
 Kuwait
-
 Kyrgyzstan
-
 Laos
Laos
-
 Latvia
-
 Lebanon
-
 Lesotho
-
 Libya
Libya
-
 Lithuania
-
 Luxembourg
-
 Madagascar
-
 Malaysia
-
 Malta
Malta
-
 Mauritius
-
 Mexico
-
 Moldova
-
 Mongolia
-
 Montenegro
-
 Morocco
-
 Mozambique
-
 Myanmar
-
 Namibia
-
 Nepal
Nepal
-
 Netherlands
-
 New Zealand
-
 Nigeria
-
 North Macedonia
-
 Norway
-
 Oman
Oman
-
 Pakistan
-
 Palestine
-
 Panama
-
 Papua New Guinea
-
 Paraguay
-
 Peru
Peru
-
 Philippines
-
 Poland
-
 Portugal
-
 Puerto Rico
-
 Qatar
Qatar
-
 Reunion
-
 Romania
-
 Rwanda
-
 Saudi Arabia
-
 Serbia
-
 Singapore
-
 Slovakia
-
 Slovenia
-
 Somalia
-
 South Africa
-
 Spain
Spain
-
 Sri Lanka
-
 Sweden
-
 Switzerland
-
 Syria
Syria
-
 Taiwan
-
 Tajikistan
-
 Tanzania
-
 Thailand
-
 Trinidad and Tobago
-
 Tunisia
-
 Turkey
-
 UAE
UAE
-
 Uganda
-
 Ukraine
-
 United Kingdom
-
United States
-
 Uruguay
-
 Uzbekistan
-
 Venezuela
-
 Vietnam
-
 Yemen
Yemen
-
 Zambia
-
 Zimbabwe
- Forex
- Crypto
