
Nvidia stock slides as technical indicators signal overbought conditions: weekly outlook

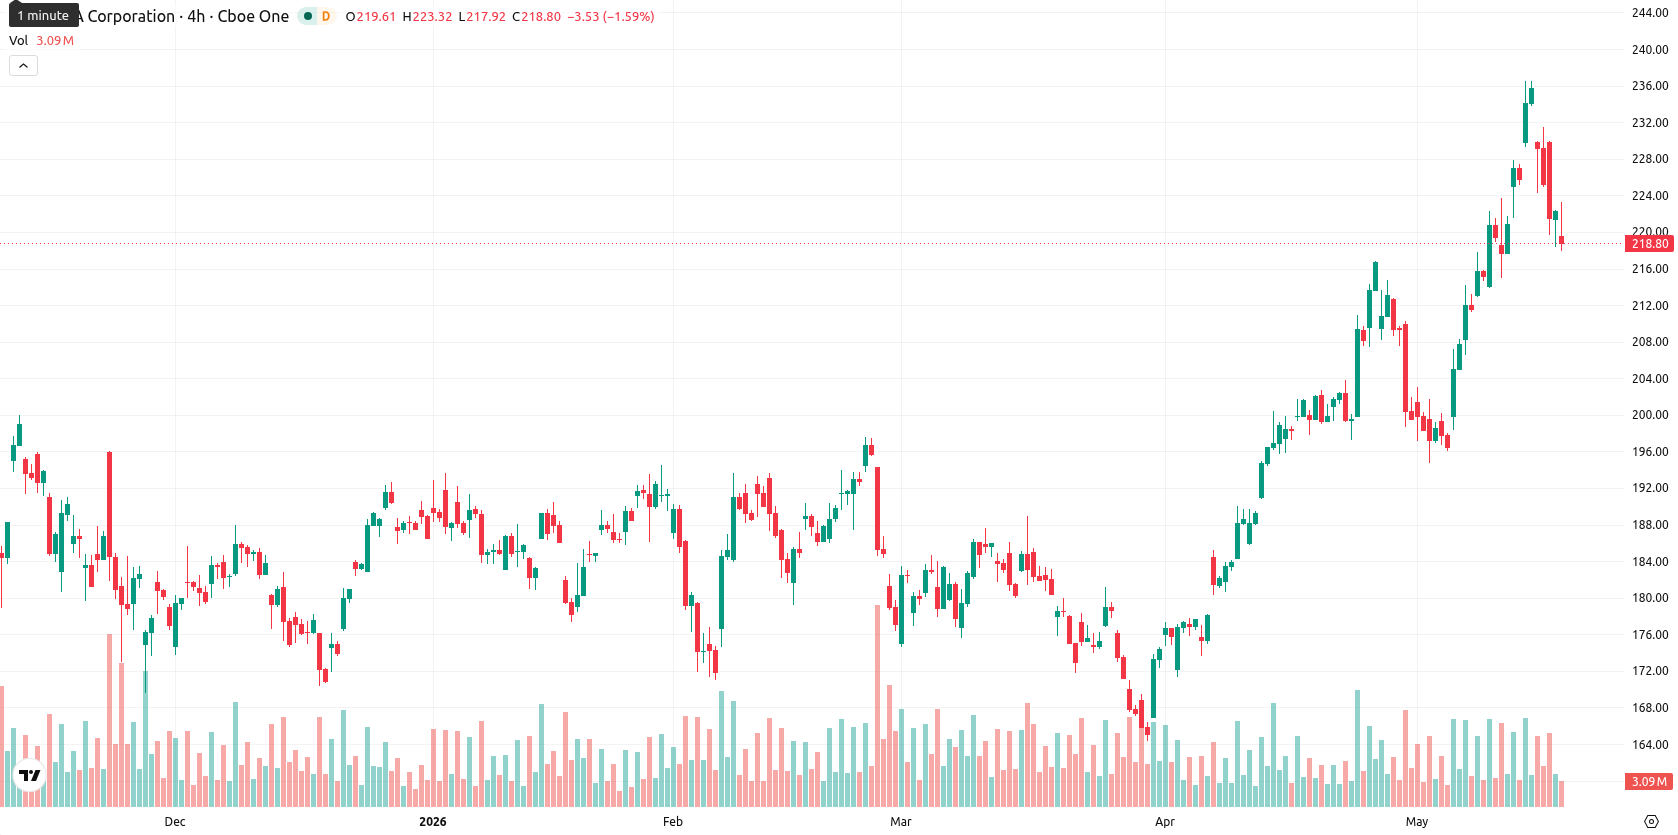
Nvidia Corporation (NVDA) is trading at $219.35, which is firmly above the weekly MA-20 ($191.00), MA-50 ($182.32), and MA-200 ($99.22), highlighting a strong medium- and long-term bullish trend. Over the past week, NVDA declined by $5.74, a drop of 2.90%, closing near the bottom of its weekly range and remaining well above all key weekly moving averages.
Highlights
- NVDA maintains a strong medium- and long-term bullish trend, trading well above all major moving averages.
- Despite bullish momentum persisting, multiple oscillators are overbought and recent weekly price action shows a 2.9% pullback with closing at the range low.
- Technical outlook for the next 7 days projects a sideways move between $202 and $237, with risk of correction if $202 support breaks.
Growth optimism as Dell partnership and fund inflows fuel sentiment
Nvidia is scheduled to report its first-quarter fiscal 2027 results on May 20, 2026, after the market close. The company recently expanded its partnership with Dell, which was highlighted at a major Dell event and underscores ongoing growth in enterprise AI infrastructure. Recent regulatory filings confirm rising institutional and hedge fund ownership in anticipation of continued demand for Nvidia’s AI and data center hardware.
Overbought signals emerge as buyers hold advantage amid consolidation
On the weekly (W1) chart, NVDA maintains a robust technical position well above the MA-20, MA-50, and MA-200, showing clear dominance of the longer-term uptrend. The Ichimoku Kijun remains far below current price levels, with the MA-50 now providing the closest dynamic support. Weekly MACD confirms bullish momentum, while ADX stays neutral. Several oscillators, including RSI W1, CCI, Stochastic RSI, and Bull/Bear Power, are in overbought territory, indicating possible buying exhaustion, though Bull/Bear Power suggests buyers still have the upper hand. The Awesome Oscillator adds a slight bullish tilt, but the week closed with the price near its lows and 8.28% volatility, reflecting consolidation and mixed momentum signals.
Neutral outlook with breakout risk as price consolidates in range
Looking ahead to the next 7 trading days, NVDA is expected to remain in a $202 to $237 range, based on current weekly volatility and technical indicators. With 2 out of 4 key weekly signals still flashing "Buy" or "Strong Buy," there is a roughly balanced probability of either a rise or a decline—continued sideways movement is most likely as the market digests earlier gains. A move above $237 could trigger renewed buying and a bullish breakout, while a fall below $202 may risk a deeper short-term correction as overbought indicators unwind.
Earlier, analysts noted that despite signs of overbought conditions, Nvidia's prevailing bullish momentum and sector optimism continued to outweigh short-term selling pressure. The current analysis adds dimension by highlighting sustained institutional demand and a strong long-term technical trend, with the primary risk now being the potential for an extended consolidation phase before the next decisive move.


-
 Afghanistan
-
 Albania
-
 Algeria
-
 Angola
-
 Argentina
-
 Armenia
-
 Australia
-
 Austria
-
 Azerbaijan
-
 Bahamas
-
 Bahrain
-
 Bangladesh
-
 Belarus
-
 Belgium
-
 Bolivia
-
 Botswana
-
 Brazil
-
 Brunei
-
 Bulgaria
-
 Cambodia
-
 Cameroon
-
 Canada
-
 Chile
Chile
-
 China
China
-
 Colombia
-
 Congo
Congo
-
 Costa Rica
-
 Cote d'Ivoire
-
 Croatia
-
 Cuba
Cuba
-
 Cyprus
-
 Czechia
-
 DR Congo
-
 Denmark
-
 Dominican Republic
-
 Ecuador
-
 Egypt
Egypt
-
 El Salvador
-
 Estonia
-
 Eswatini
-
 Ethiopia
-
 Finland
-
 France
-
 Georgia
-
 Germany
-
 Ghana
Ghana
-
 Greece
-
 Haiti
Haiti
-
 Hong Kong
-
 Hungary
-
 India
India
-
 Indonesia
-
 Iran, Islamic republic
-
 Iraq
Iraq
-
 Ireland
-
 Israel
-
 Italy
Italy
-
 Jamaica
-
 Japan
Japan
-
 Jordan
-
 Kazakhstan
-
 Kenya
Kenya
-
 Korea
Korea
-
 Kuwait
-
 Kyrgyzstan
-
 Laos
Laos
-
 Latvia
-
 Lebanon
-
 Lesotho
-
 Libya
Libya
-
 Lithuania
-
 Luxembourg
-
 Madagascar
-
 Malaysia
-
 Malta
Malta
-
 Mauritius
-
 Mexico
-
 Moldova
-
 Mongolia
-
 Montenegro
-
 Morocco
-
 Mozambique
-
 Myanmar
-
 Namibia
-
 Nepal
Nepal
-
 Netherlands
-
 New Zealand
-
 Nigeria
-
 North Macedonia
-
 Norway
-
 Oman
Oman
-
 Pakistan
-
 Palestine
-
 Panama
-
 Papua New Guinea
-
 Paraguay
-
 Peru
Peru
-
 Philippines
-
 Poland
-
 Portugal
-
 Puerto Rico
-
 Qatar
Qatar
-
 Reunion
-
 Romania
-
 Rwanda
-
 Saudi Arabia
-
 Serbia
-
 Singapore
-
 Slovakia
-
 Slovenia
-
 Somalia
-
 South Africa
-
 Spain
Spain
-
 Sri Lanka
-
 Sweden
-
 Switzerland
-
 Syria
Syria
-
 Taiwan
-
 Tajikistan
-
 Tanzania
-
 Thailand
-
 Trinidad and Tobago
-
 Tunisia
-
 Turkey
-
 UAE
UAE
-
 Uganda
-
 Ukraine
-
 United Kingdom
-
United States
-
 Uruguay
-
 Uzbekistan
-
 Venezuela
-
 Vietnam
-
 Yemen
Yemen
-
 Zambia
-
 Zimbabwe
- Forex
- Crypto
