
Failed breakout attempts drive AMD stock lower after extended run above major averages

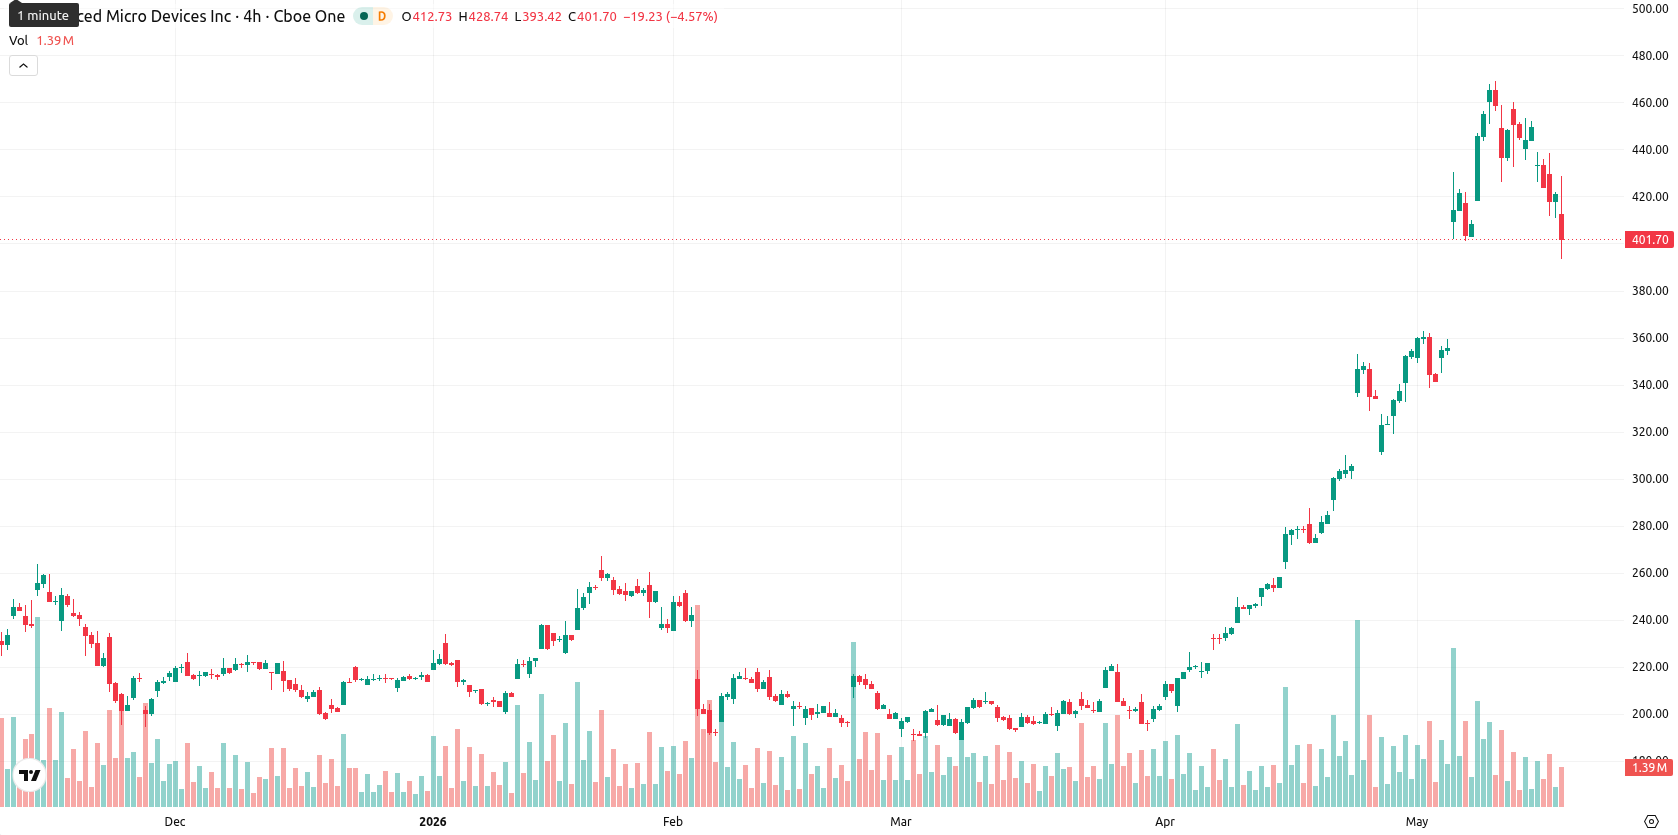
Advanced Micro Devices, Inc. (AMD) is trading at $404.87, down 3.88% from the previous session. The price remains firmly above its key moving averages, indicating AMD is holding a bullish profile across short-, medium-, and long-term frameworks.
Highlights
- AMD maintains a firm bullish trend across all timeframes, trading well above key support levels after a recent pullback.
- Momentum indicators reflect strong underlying trend strength, but mixed signals and overbought readings suggest short-term volatility and profit-taking risk.
- For the next five trading days, anticipated price action is volatile within a $393.00–$425.00 range, with over 80% probability of an upward move.
Sustained momentum and mixed signals as technical indicators diverge
On the technical front, AMD remains well above the D1 SMA-20 ($379.06), SMA-50 ($283.80), and SMA-200 ($225.41), reinforcing bullish momentum across primary timeframes. The Ichimoku Kijun level at $355.63 currently acts as an immediate support. The D1 MACD issues a Strong Buy signal, while the ADX is elevated at 42.39, marking robust trend strength. Conversely, the Stoch RSI points to oversold conditions, CCI shows ongoing bullish pressure, and the D1 RSI is high but not at extreme levels. Bull/Bear Power (BBP) on the daily chart signals continued buyer dominance, while intraday readings at shorter intervals reflect notable selling activity. The Awesome Oscillator remains neutral, suggesting neither a strong reinforcement nor a reversal of the prevailing trend. Diverging oscillators highlight increased volatility and the presence of both sustained buyer activity and profit-taking.
Sideways trading favored as volatility and breakout risks increase
Over the next five trading days, AMD is expected to fluctuate within a typical volatility band from $393.00 to $425.00. The probability of an upward move remains above 80%, supported by established technical strength. The main scenario anticipates sideways price movement within this volatile corridor. A confirmed break above $425.00 would create scope for further upside, whereas a dip below $393.00 could trigger a short-term corrective move before new support emerges.
Previously it was reported that AMD maintained a robust bullish technical structure with limited downside risk. The current analysis reinforces this outlook with fresh momentum readings and highlights that a sustained move above $425.00 could catalyze further gains, making that the key level for traders to monitor in the near term.


Latest AMD News


-
 Afghanistan
-
 Albania
-
 Algeria
-
 Angola
-
 Argentina
-
 Armenia
-
 Australia
-
 Austria
-
 Azerbaijan
-
 Bahamas
-
 Bahrain
-
 Bangladesh
-
 Belarus
-
 Belgium
-
 Bolivia
-
 Botswana
-
 Brazil
-
 Brunei
-
 Bulgaria
-
 Cambodia
-
 Cameroon
-
 Canada
-
 Chile
Chile
-
 China
China
-
 Colombia
-
 Congo
Congo
-
 Costa Rica
-
 Cote d'Ivoire
-
 Croatia
-
 Cuba
Cuba
-
 Cyprus
-
 Czechia
-
 DR Congo
-
 Denmark
-
 Dominican Republic
-
 Ecuador
-
 Egypt
Egypt
-
 El Salvador
-
 Estonia
-
 Eswatini
-
 Ethiopia
-
 Finland
-
 France
-
 Georgia
-
 Germany
-
 Ghana
Ghana
-
 Greece
-
 Haiti
Haiti
-
 Hong Kong
-
 Hungary
-
 India
India
-
 Indonesia
-
 Iran, Islamic republic
-
 Iraq
Iraq
-
 Ireland
-
 Israel
-
 Italy
Italy
-
 Jamaica
-
 Japan
Japan
-
 Jordan
-
 Kazakhstan
-
 Kenya
Kenya
-
 Korea
Korea
-
 Kuwait
-
 Kyrgyzstan
-
 Laos
Laos
-
 Latvia
-
 Lebanon
-
 Lesotho
-
 Libya
Libya
-
 Lithuania
-
 Luxembourg
-
 Madagascar
-
 Malaysia
-
 Malta
Malta
-
 Mauritius
-
 Mexico
-
 Moldova
-
 Mongolia
-
 Montenegro
-
 Morocco
-
 Mozambique
-
 Myanmar
-
 Namibia
-
 Nepal
Nepal
-
 Netherlands
-
 New Zealand
-
 Nigeria
-
 North Macedonia
-
 Norway
-
 Oman
Oman
-
 Pakistan
-
 Palestine
-
 Panama
-
 Papua New Guinea
-
 Paraguay
-
 Peru
Peru
-
 Philippines
-
 Poland
-
 Portugal
-
 Puerto Rico
-
 Qatar
Qatar
-
 Reunion
-
 Romania
-
 Rwanda
-
 Saudi Arabia
-
 Serbia
-
 Singapore
-
 Slovakia
-
 Slovenia
-
 Somalia
-
 South Africa
-
 Spain
Spain
-
 Sri Lanka
-
 Sweden
-
 Switzerland
-
 Syria
Syria
-
 Taiwan
-
 Tajikistan
-
 Tanzania
-
 Thailand
-
 Trinidad and Tobago
-
 Tunisia
-
 Turkey
-
 UAE
UAE
-
 Uganda
-
 Ukraine
-
 United Kingdom
-
United States
-
 Uruguay
-
 Uzbekistan
-
 Venezuela
-
 Vietnam
-
 Yemen
Yemen
-
 Zambia
-
 Zimbabwe
- Forex
- Crypto
