
AMD shares show mixed momentum with CCI flagging overbought signals: weekly report

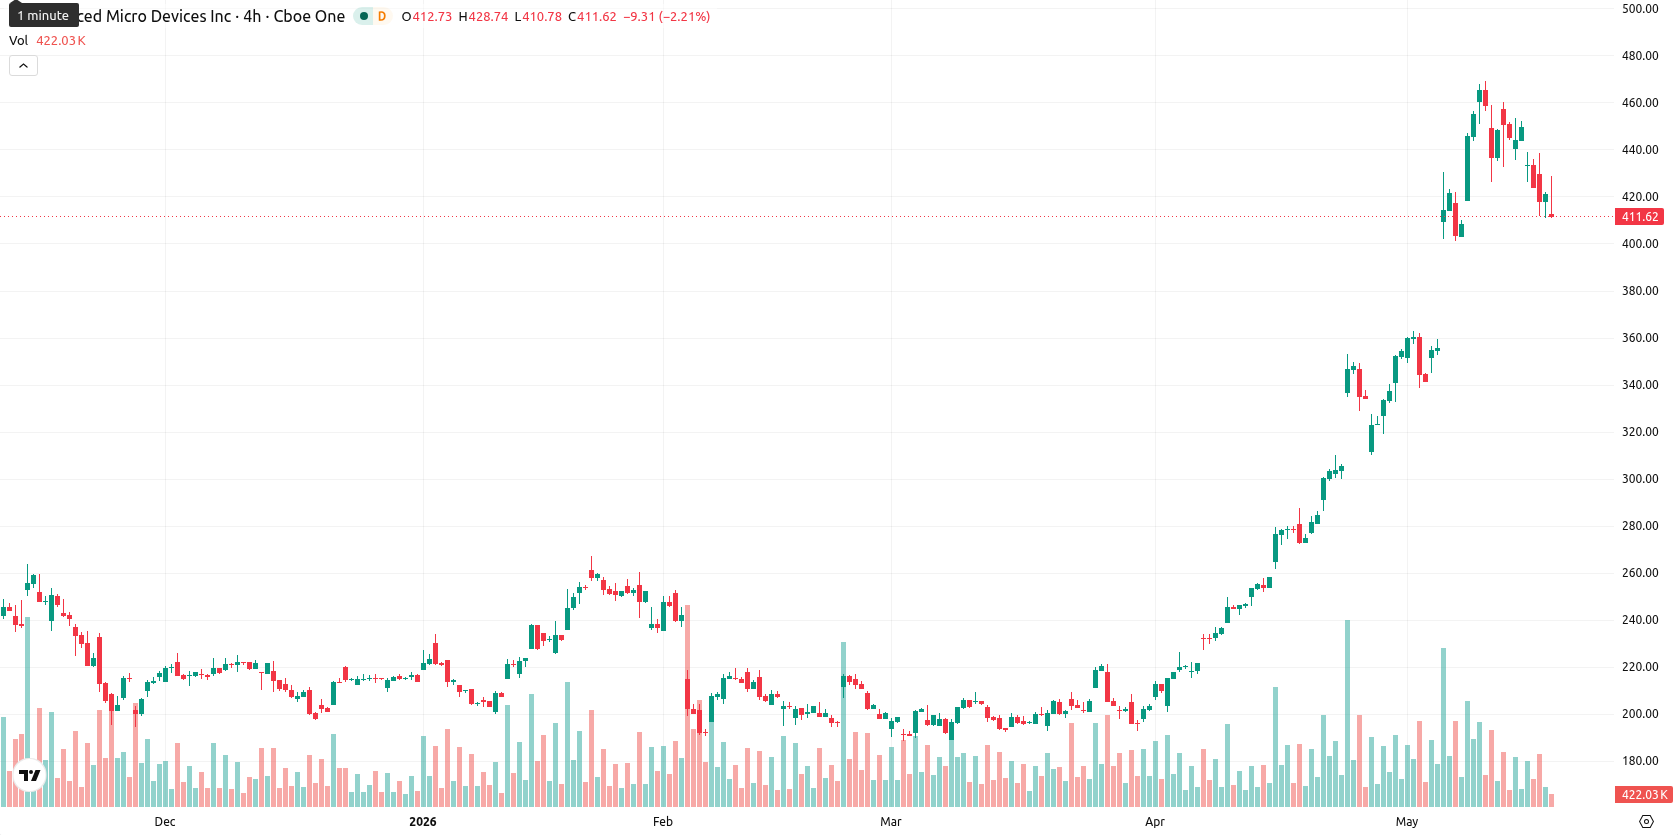
Advanced Micro Devices, Inc. (AMD) is trading at $421.21, placing it well above its weekly MA-20 ($264.33), MA-50 ($217.30), and MA-200 ($143.26), which underscores a sustained bullish structure on the medium- and long-term chart. Over the past week, AMD has declined by $2.72, representing a 0.64% pullback, and the price currently sits toward the lower end of its weekly range.
Highlights
- AMD maintains a strong bullish trend, trading well above key longer-term moving averages and reinforcing upward momentum.
- Technical momentum remains positive despite overbought signals, with buyers dominant and indicators skewed toward a continued rally.
- Price is likely to consolidate in a $385 to $460 range for the coming week, with a 75% probability of upside breakout.
Momentum remains strong as overbought signals emerge during the week
Technically, AMD remains in a robust uptrend on the weekly timeframe, with dynamic support found near the MA-50 and Ichimoku Kijun at $328.72, both significantly below the current price. Weekly momentum signals are strong, with the MACD and ADX firmly positive, while RSI is bullish but approaching overbought territory; however, the CCI highlights overbought conditions and the Stochastic RSI is neutral. Bull/Bear Power continues to indicate buyer strength, and the Awesome Oscillator trends upward, although an 11.87% volatility suggests heightened risk of swings. After a sharp run-up and recent pullback, price action aligns with potential range-bound consolidation.
Upside bias persists amid range-bound risk for the coming week
For the upcoming 5 trading days, AMD is expected to trade between $385 and $460 based on its present weekly volatility and the supportive trend from key indicators. With 3 out of 4 primary signals pointing to a buy or strong buy (RSI, MACD, ADX), there is estimated to be a 75% probability of continued upside and a 25% chance of further pullback. The base case scenario projects consolidation within the outlined range as market participants reassess positions. If the price breaks above $460, AMD could attempt new all-time highs, while a break below $385 might lead to increased profit-taking and a deeper retracement toward underlying supports.
Previously it was reported that AMD maintained a robust bullish posture with strong technical indicators and limited downside risk. The latest analysis reinforces this outlook while highlighting elevated volatility and a wider trading band, suggesting investors should closely monitor $460 as a potential breakout threshold in the near term.


Latest AMD News


-
 Afghanistan
-
 Albania
-
 Algeria
-
 Angola
-
 Argentina
-
 Armenia
-
 Australia
-
 Austria
-
 Azerbaijan
-
 Bahamas
-
 Bahrain
-
 Bangladesh
-
 Belarus
-
 Belgium
-
 Bolivia
-
 Botswana
-
 Brazil
-
 Brunei
-
 Bulgaria
-
 Cambodia
-
 Cameroon
-
 Canada
-
 Chile
Chile
-
 China
China
-
 Colombia
-
 Congo
Congo
-
 Costa Rica
-
 Cote d'Ivoire
-
 Croatia
-
 Cuba
Cuba
-
 Cyprus
-
 Czechia
-
 DR Congo
-
 Denmark
-
 Dominican Republic
-
 Ecuador
-
 Egypt
Egypt
-
 El Salvador
-
 Estonia
-
 Eswatini
-
 Ethiopia
-
 Finland
-
 France
-
 Georgia
-
 Germany
-
 Ghana
Ghana
-
 Greece
-
 Haiti
Haiti
-
 Hong Kong
-
 Hungary
-
 India
India
-
 Indonesia
-
 Iran, Islamic republic
-
 Iraq
Iraq
-
 Ireland
-
 Israel
-
 Italy
Italy
-
 Jamaica
-
 Japan
Japan
-
 Jordan
-
 Kazakhstan
-
 Kenya
Kenya
-
 Korea
Korea
-
 Kuwait
-
 Kyrgyzstan
-
 Laos
Laos
-
 Latvia
-
 Lebanon
-
 Lesotho
-
 Libya
Libya
-
 Lithuania
-
 Luxembourg
-
 Madagascar
-
 Malaysia
-
 Malta
Malta
-
 Mauritius
-
 Mexico
-
 Moldova
-
 Mongolia
-
 Montenegro
-
 Morocco
-
 Mozambique
-
 Myanmar
-
 Namibia
-
 Nepal
Nepal
-
 Netherlands
-
 New Zealand
-
 Nigeria
-
 North Macedonia
-
 Norway
-
 Oman
Oman
-
 Pakistan
-
 Palestine
-
 Panama
-
 Papua New Guinea
-
 Paraguay
-
 Peru
Peru
-
 Philippines
-
 Poland
-
 Portugal
-
 Puerto Rico
-
 Qatar
Qatar
-
 Reunion
-
 Romania
-
 Rwanda
-
 Saudi Arabia
-
 Serbia
-
 Singapore
-
 Slovakia
-
 Slovenia
-
 Somalia
-
 South Africa
-
 Spain
Spain
-
 Sri Lanka
-
 Sweden
-
 Switzerland
-
 Syria
Syria
-
 Taiwan
-
 Tajikistan
-
 Tanzania
-
 Thailand
-
 Trinidad and Tobago
-
 Tunisia
-
 Turkey
-
 UAE
UAE
-
 Uganda
-
 Ukraine
-
 United Kingdom
-
United States
-
 Uruguay
-
 Uzbekistan
-
 Venezuela
-
 Vietnam
-
 Yemen
Yemen
-
 Zambia
-
 Zimbabwe
- Forex
- Crypto
