
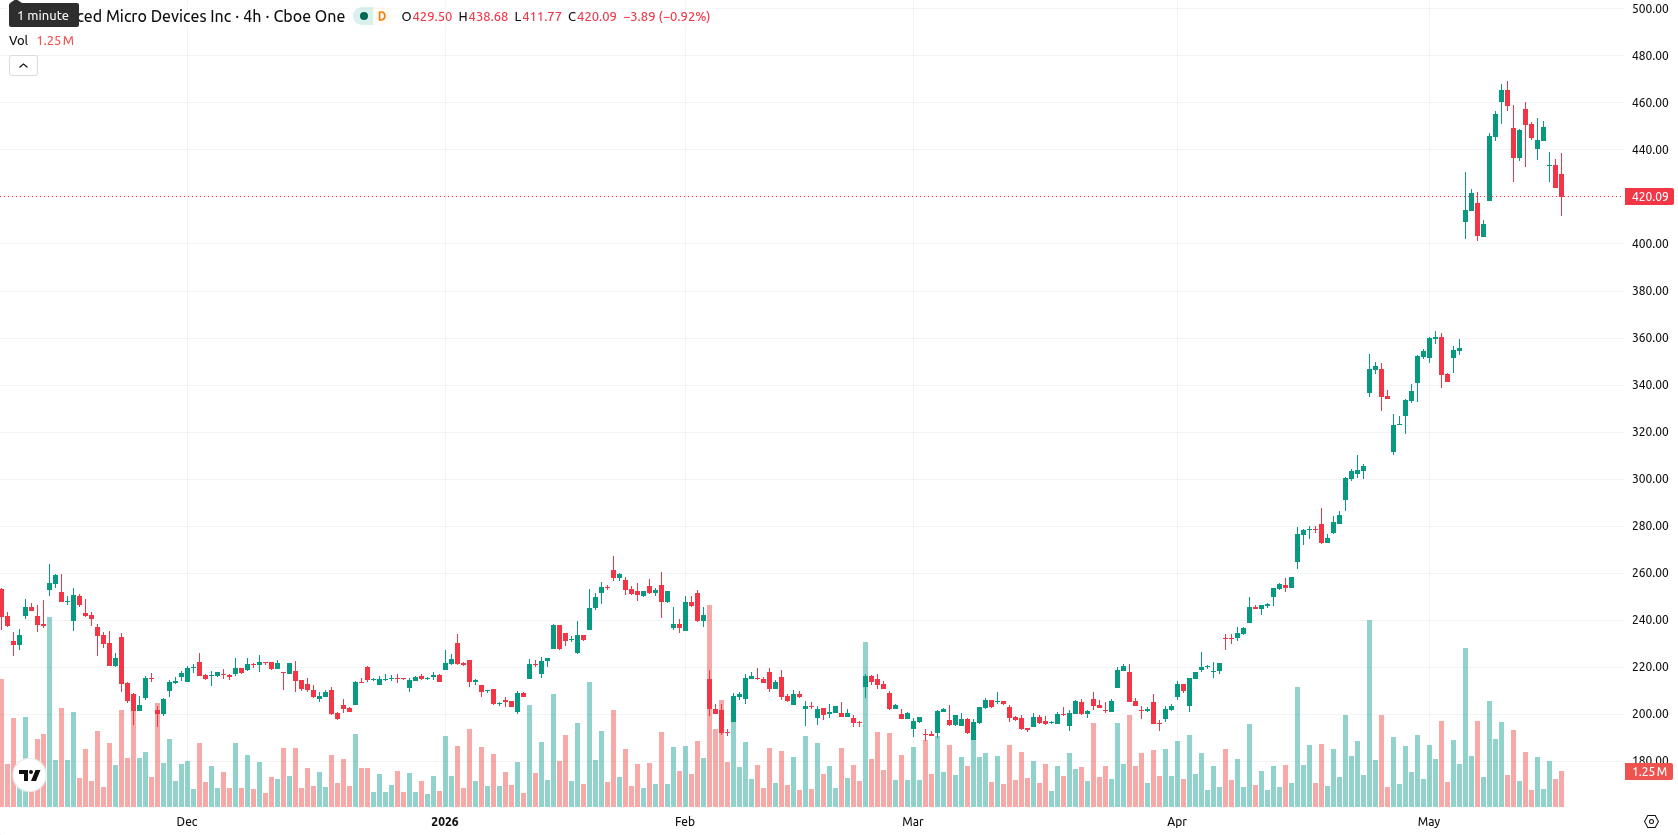
AMD stock consolidates as price holds above $400 support

Advanced Micro Devices, Inc. (AMD) is trading at $420.85, down 0.73% for the day. The stock remains well above its key moving averages, reflecting persistent strength relative to short-, medium-, and long-term trend levels.
Highlights
- AMD remains in a strong bullish trend, trading well above short, medium, and long-term support levels.
- Momentum indicators remain bullish overall, but oscillators indicate overbought conditions and suggest possible short-term consolidation.
- The expected five-day price range is $400 to $440, with an 80% probability of further upside and limited downside risk.
Momentum divergence appears as AMD tests support amid intraday pressure
A closer look at the technical picture shows AMD trading well above its SMA-20 at $371.74, SMA-50 at $279.22, and SMA-200 at $224.19. The Ichimoku Kijun level at $355.23 serves as immediate support below the current price. Momentum indicators on the daily chart remain firmly bullish, as both MACD and ADX highlight strong upward strength. However, there are clear signs of divergence among oscillators: RSI signals continued buying, Stoch RSI flags an oversold condition, and the CCI is deep in overbought territory. The BBP confirms buyers maintain control. Despite strong momentum, today's price sits near the lower end of the intraday range ($412.27–$432.22) following a $3.08 pullback after a gap-up opening, with moderate volatility and emerging intraday pressure.
Sideways scenario expected as volatility bands contain price movement
Over the coming week, the expected price range for AMD is projected between $400 and $440, based on typical volatility and current levels. There is a very high probability (over 80%) that the price will remain firm or move higher, while the odds of a pullback are notably lower. The central scenario envisions sideways consolidation within this volatility band. A sustained break above $440 could trigger a new leg up, while any slide below $400 would likely be cushioned by persistent trend support.
Previously it was reported that AMD demonstrated robust bullish momentum supported by strong technicals and limited downside risk. The latest analysis reinforces this favorable outlook, with persistent trend strength suggesting that any near-term price weakness is likely to be met with sustained buying interest—making breakout levels above $440 particularly significant for fresh upside potential.


Latest AMD News


-
 Afghanistan
-
 Albania
-
 Algeria
-
 Angola
-
 Argentina
-
 Armenia
-
 Australia
-
 Austria
-
 Azerbaijan
-
 Bahamas
-
 Bahrain
-
 Bangladesh
-
 Belarus
-
 Belgium
-
 Bolivia
-
 Botswana
-
 Brazil
-
 Brunei
-
 Bulgaria
-
 Cambodia
-
 Cameroon
-
 Canada
-
 Chile
Chile
-
 China
China
-
 Colombia
-
 Congo
Congo
-
 Costa Rica
-
 Cote d'Ivoire
-
 Croatia
-
 Cuba
Cuba
-
 Cyprus
-
 Czechia
-
 DR Congo
-
 Denmark
-
 Dominican Republic
-
 Ecuador
-
 Egypt
Egypt
-
 El Salvador
-
 Estonia
-
 Eswatini
-
 Ethiopia
-
 Finland
-
 France
-
 Georgia
-
 Germany
-
 Ghana
Ghana
-
 Greece
-
 Haiti
Haiti
-
 Hong Kong
-
 Hungary
-
 India
India
-
 Indonesia
-
 Iran, Islamic republic
-
 Iraq
Iraq
-
 Ireland
-
 Israel
-
 Italy
Italy
-
 Jamaica
-
 Japan
Japan
-
 Jordan
-
 Kazakhstan
-
 Kenya
Kenya
-
 Korea
Korea
-
 Kuwait
-
 Kyrgyzstan
-
 Laos
Laos
-
 Latvia
-
 Lebanon
-
 Lesotho
-
 Libya
Libya
-
 Lithuania
-
 Luxembourg
-
 Madagascar
-
 Malaysia
-
 Malta
Malta
-
 Mauritius
-
 Mexico
-
 Moldova
-
 Mongolia
-
 Montenegro
-
 Morocco
-
 Mozambique
-
 Myanmar
-
 Namibia
-
 Nepal
Nepal
-
 Netherlands
-
 New Zealand
-
 Nigeria
-
 North Macedonia
-
 Norway
-
 Oman
Oman
-
 Pakistan
-
 Palestine
-
 Panama
-
 Papua New Guinea
-
 Paraguay
-
 Peru
Peru
-
 Philippines
-
 Poland
-
 Portugal
-
 Puerto Rico
-
 Qatar
Qatar
-
 Reunion
-
 Romania
-
 Rwanda
-
 Saudi Arabia
-
 Serbia
-
 Singapore
-
 Slovakia
-
 Slovenia
-
 Somalia
-
 South Africa
-
 Spain
Spain
-
 Sri Lanka
-
 Sweden
-
 Switzerland
-
 Syria
Syria
-
 Taiwan
-
 Tajikistan
-
 Tanzania
-
 Thailand
-
 Trinidad and Tobago
-
 Tunisia
-
 Turkey
-
 UAE
UAE
-
 Uganda
-
 Ukraine
-
 United Kingdom
-
United States
-
 Uruguay
-
 Uzbekistan
-
 Venezuela
-
 Vietnam
-
 Yemen
Yemen
-
 Zambia
-
 Zimbabwe
- Forex
- Crypto
