
AMD stock slides as buyers struggle to hold above key moving averages

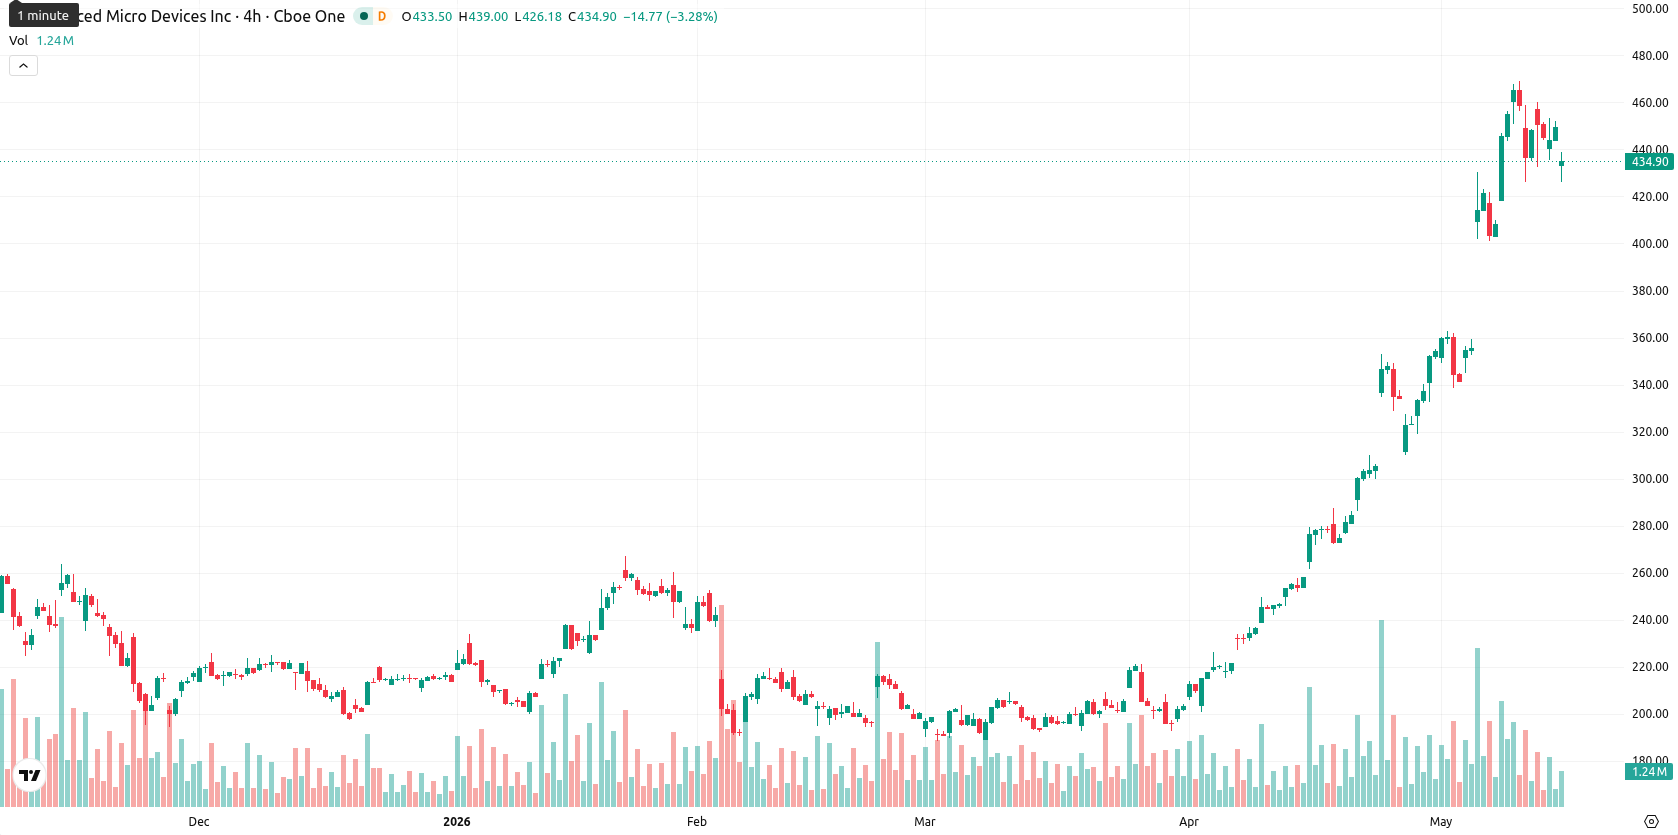
Advanced Micro Devices, Inc. (AMD) is trading at $435.54, posting a 2.56% decline for the day. The share price remains positioned well above its key moving averages, underscoring a firm technical structure despite today's negative move.
Highlights
- AMD maintains a strong bullish trend, trading well above major moving averages across all timeframes.
- Short-term momentum is strong but overbought, with daily volatility elevated and intraday price action under selling pressure.
- AMD is expected to consolidate between $426 and $449 over the next five days, with an upside breakout more likely than a downside move.
Mixed momentum as overbought signals counter multi-support technicals
At $435.54, AMD is well above the SMA-20 ($364.31), SMA-50 ($274.68), and SMA-200 ($222.95). The Ichimoku Kijun on the daily timeframe is positioned at $350.07, marking immediate support for the current structure. Intraday price action highlights a downside gap from $447.00 to $430.75, with AMD currently trading mid-range between $426.30 and $438.55. Momentum indicators present a mixed setup: MACD and ADX remain in buy mode, yet RSI at 76.3 and CCI at 105.77 signal overbought conditions, and BBP shows pronounced buyer dominance. Stoch RSI aligns with upside bias, but high daily volatility and weak sessions after the open reflect divergence between short-term and longer-term signals.
Limited downside risk as bullish technicals reinforce range outlook
The short-term forecast expects AMD to move within a $426 to $449 price corridor, representing the typical volatility band relative to current levels. There is an over 80% probability of upward movement, supported by strong buy signals from weekly RSI, ADX, MACD, and MA-50, making declines less likely. The base case projects sideways action within the prevailing range. If momentum revives and resistance at $449 is decisively breached, a bullish extension may develop, while a drop below $426 support could trigger a deeper pullback, although weekly technicals suggest this probability remains limited.
Previously it was reported that AMD demonstrated strong bullish momentum driven by robust earnings, institutional accumulation, and solid technical structure. While the current pullback reflects heightened volatility and overbought conditions, traders should watch for a potential bullish breakout above $449 or a downside move below $426 as decisive signals for the next trend direction.


Latest AMD News


-
 Afghanistan
-
 Albania
-
 Algeria
-
 Angola
-
 Argentina
-
 Armenia
-
 Australia
-
 Austria
-
 Azerbaijan
-
 Bahamas
-
 Bahrain
-
 Bangladesh
-
 Belarus
-
 Belgium
-
 Bolivia
-
 Botswana
-
 Brazil
-
 Brunei
-
 Bulgaria
-
 Cambodia
-
 Cameroon
-
 Canada
-
 Chile
Chile
-
 China
China
-
 Colombia
-
 Congo
Congo
-
 Costa Rica
-
 Cote d'Ivoire
-
 Croatia
-
 Cuba
Cuba
-
 Cyprus
-
 Czechia
-
 DR Congo
-
 Denmark
-
 Dominican Republic
-
 Ecuador
-
 Egypt
Egypt
-
 El Salvador
-
 Estonia
-
 Eswatini
-
 Ethiopia
-
 Finland
-
 France
-
 Georgia
-
 Germany
-
 Ghana
Ghana
-
 Greece
-
 Haiti
Haiti
-
 Hong Kong
-
 Hungary
-
 India
India
-
 Indonesia
-
 Iran, Islamic republic
-
 Iraq
Iraq
-
 Ireland
-
 Israel
-
 Italy
Italy
-
 Jamaica
-
 Japan
Japan
-
 Jordan
-
 Kazakhstan
-
 Kenya
Kenya
-
 Korea
Korea
-
 Kuwait
-
 Kyrgyzstan
-
 Laos
Laos
-
 Latvia
-
 Lebanon
-
 Lesotho
-
 Libya
Libya
-
 Lithuania
-
 Luxembourg
-
 Madagascar
-
 Malaysia
-
 Malta
Malta
-
 Mauritius
-
 Mexico
-
 Moldova
-
 Mongolia
-
 Montenegro
-
 Morocco
-
 Mozambique
-
 Myanmar
-
 Namibia
-
 Nepal
Nepal
-
 Netherlands
-
 New Zealand
-
 Nigeria
-
 North Macedonia
-
 Norway
-
 Oman
Oman
-
 Pakistan
-
 Palestine
-
 Panama
-
 Papua New Guinea
-
 Paraguay
-
 Peru
Peru
-
 Philippines
-
 Poland
-
 Portugal
-
 Puerto Rico
-
 Qatar
Qatar
-
 Reunion
-
 Romania
-
 Rwanda
-
 Saudi Arabia
-
 Serbia
-
 Singapore
-
 Slovakia
-
 Slovenia
-
 Somalia
-
 South Africa
-
 Spain
Spain
-
 Sri Lanka
-
 Sweden
-
 Switzerland
-
 Syria
Syria
-
 Taiwan
-
 Tajikistan
-
 Tanzania
-
 Thailand
-
 Trinidad and Tobago
-
 Tunisia
-
 Turkey
-
 UAE
UAE
-
 Uganda
-
 Ukraine
-
 United Kingdom
-
United States
-
 Uruguay
-
 Uzbekistan
-
 Venezuela
-
 Vietnam
-
 Yemen
Yemen
-
 Zambia
-
 Zimbabwe
- Forex
- Crypto
