
SoFi stock drops 3.65% as Technology Platform revenue falls after client loss

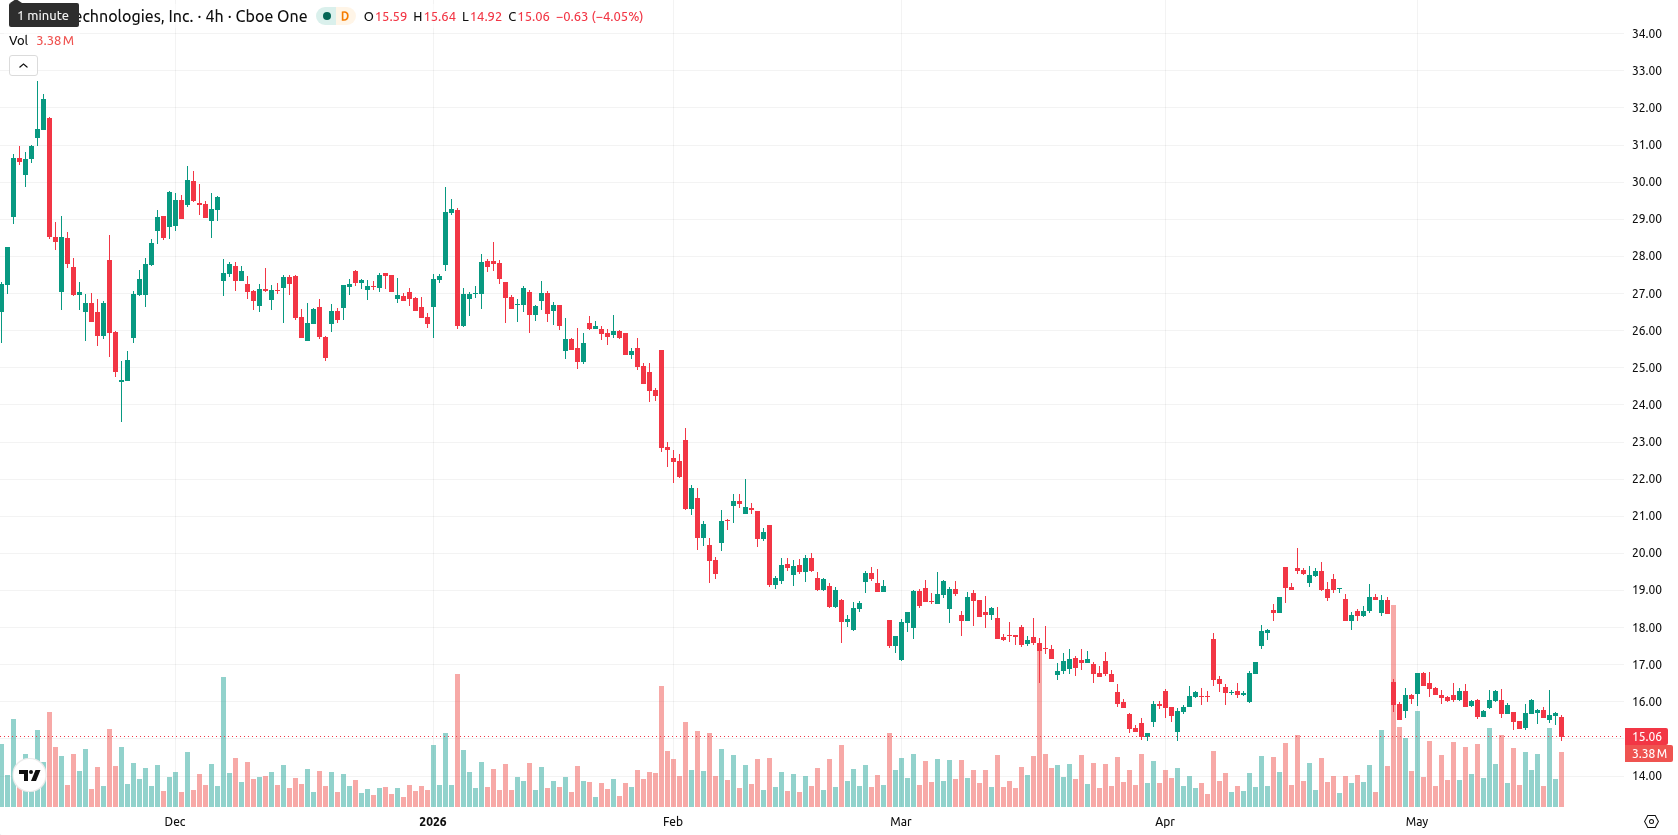
SoFi Technologies, Inc. (SOFI) is trading at $15.05, marking a daily decline of 3.65%. The asset remains positioned below its key moving averages, indicating ongoing negative momentum.
Highlights
- SoFi delivered a 41% year-over-year revenue jump to $1.10 billion and doubled GAAP net income to $166.7 million, with record loan originations of $12.18 billion.
- Member growth soared 35% to reach 14.7 million, but Technology Platform revenue dropped 27% due to a major client loss, raising diversification concerns.
- SOFI trades below key technical levels with bearish momentum, expects to fluctuate between $14.80 and $16.30, and shows low probability of a near-term price rebound.
Lending growth offset by platform segment loss and weak price response
On May 18, 2026, SoFi reported first-quarter results with revenue rising 41% year-over-year to $1.10 billion, more than doubling GAAP net income to $166.7 million, and achieving record loan originations of $12.18 billion, reflecting strength in its core lending business. However, the Technology Platform segment saw a 27% revenue decline due to a key client departure, weighing on segment performance and raising concerns about growth diversification. The company also reported a 35% increase in members to 14.7 million and secured a majority stake in UK-based PrimaryBid to broaden its investment offerings, though price action has remained under broader selling pressure.
Bearish setup and low momentum as sellers test support levels
Technically, SOFI has remained below several key levels: the SMA-20 at $16.74, the SMA-50 at $16.98, and the SMA-200 at $23.45. The Ichimoku Kijun level at $17.68 stands out as the nearest resistance, while support is identified near $14.80. MACD continues to register a bearish configuration, with the ADX at 19.79 highlighting low trend strength. Oscillators point to persistent weakness — RSI is at 41.25, Stoch RSI reads 73.17 (neutral), and CCI is mildly negative at –59.29. The Awesome Oscillator and the BBP (0.18, in the oversold range) confirm sellers' dominance in short-term price action.
Sideways consolidation expected amid persistent downside pressure
Given ongoing downside momentum, the short-term outlook for SOFI anticipates a price range bounded by $14.80 and $16.30, aligned with typical volatility at current levels. The likelihood of a material upward move is assessed as very low, with expectations centered on a sideways pattern within this band. A decisive bullish shift would require a clear close above the $17.70 resistance, while a close below $14.80 could trigger renewed selling and accelerate declines.
Earlier, analysts noted that SoFi remained under technical pressure despite positive operational updates, with momentum indicators favoring continued weakness. With the stock still trending below key averages and profit-taking dominating short-term price action, traders should remain alert to potential volatility if support at $14.80 fails to hold in the coming sessions.


Latest SoFi News


-
 Afghanistan
-
 Albania
-
 Algeria
-
 Angola
-
 Argentina
-
 Armenia
-
 Australia
-
 Austria
-
 Azerbaijan
-
 Bahamas
-
 Bahrain
-
 Bangladesh
-
 Belarus
-
 Belgium
-
 Bolivia
-
 Botswana
-
 Brazil
-
 Brunei
-
 Bulgaria
-
 Cambodia
-
 Cameroon
-
 Canada
-
 Chile
Chile
-
 China
China
-
 Colombia
-
 Congo
Congo
-
 Costa Rica
-
 Cote d'Ivoire
-
 Croatia
-
 Cuba
Cuba
-
 Cyprus
-
 Czechia
-
 DR Congo
-
 Denmark
-
 Dominican Republic
-
 Ecuador
-
 Egypt
Egypt
-
 El Salvador
-
 Estonia
-
 Eswatini
-
 Ethiopia
-
 Finland
-
 France
-
 Georgia
-
 Germany
-
 Ghana
Ghana
-
 Greece
-
 Haiti
Haiti
-
 Hong Kong
-
 Hungary
-
 India
India
-
 Indonesia
-
 Iran, Islamic republic
-
 Iraq
Iraq
-
 Ireland
-
 Israel
-
 Italy
Italy
-
 Jamaica
-
 Japan
Japan
-
 Jordan
-
 Kazakhstan
-
 Kenya
Kenya
-
 Korea
Korea
-
 Kuwait
-
 Kyrgyzstan
-
 Laos
Laos
-
 Latvia
-
 Lebanon
-
 Lesotho
-
 Libya
Libya
-
 Lithuania
-
 Luxembourg
-
 Madagascar
-
 Malaysia
-
 Malta
Malta
-
 Mauritius
-
 Mexico
-
 Moldova
-
 Mongolia
-
 Montenegro
-
 Morocco
-
 Mozambique
-
 Myanmar
-
 Namibia
-
 Nepal
Nepal
-
 Netherlands
-
 New Zealand
-
 Nigeria
-
 North Macedonia
-
 Norway
-
 Oman
Oman
-
 Pakistan
-
 Palestine
-
 Panama
-
 Papua New Guinea
-
 Paraguay
-
 Peru
Peru
-
 Philippines
-
 Poland
-
 Portugal
-
 Puerto Rico
-
 Qatar
Qatar
-
 Reunion
-
 Romania
-
 Rwanda
-
 Saudi Arabia
-
 Serbia
-
 Singapore
-
 Slovakia
-
 Slovenia
-
 Somalia
-
 South Africa
-
 Spain
Spain
-
 Sri Lanka
-
 Sweden
-
 Switzerland
-
 Syria
Syria
-
 Taiwan
-
 Tajikistan
-
 Tanzania
-
 Thailand
-
 Trinidad and Tobago
-
 Tunisia
-
 Turkey
-
 UAE
UAE
-
 Uganda
-
 Ukraine
-
 United Kingdom
-
United States
-
 Uruguay
-
 Uzbekistan
-
 Venezuela
-
 Vietnam
-
 Yemen
Yemen
-
 Zambia
-
 Zimbabwe
- Forex
- Crypto
