
Oversold stretch limits fresh selling in CME Group stock slide

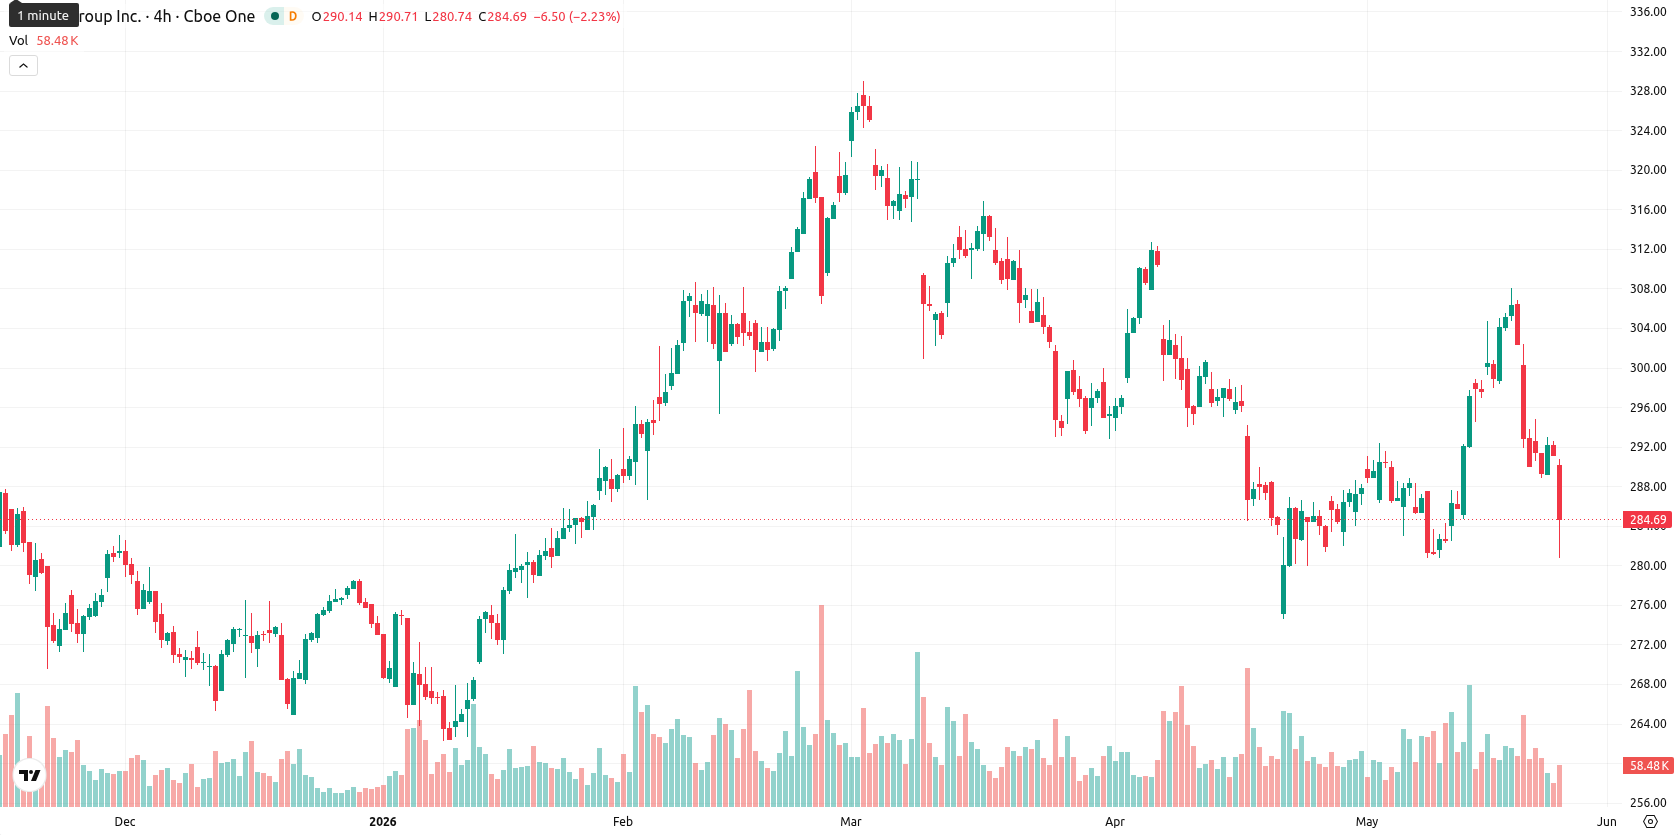
CME Group Inc. (CME) stock is trading at $282.00, down 3.17% on the day. The price sits below its key moving averages, settling just under its longer-term trend line to start the session.
Highlights
- CME trades below key short- and medium-term moving averages, indicating sustained bearish pressure and a weak technical setup.
- Momentum indicators remain negative to neutral, with sellers dominating and intraday trading near the session low following a gapless lower open.
- Expected five-day range is $275–$290, with low probability of an upside move and risk of testing support near $275 if downside persists.
Bearish signals align as technical barriers and seller momentum persist
CME is trading below the 20-day moving average at $290.24 and the 50-day moving average at $295.65, with price also sitting just under the 200-day moving average at $282.69. The Ichimoku Kijun level stands at $291.31, providing immediate technical resistance. D1 ADX signals a modest sell trend, while MACD is neutral. RSI on the daily timeframe is 48.33, pointing to mild bearish momentum. Both Stoch RSI and CCI indicate neutral-to-oversold conditions, and Bull/Bear Power (BBP) remains in oversold territory, confirming seller dominance intraday. The Awesome Oscillator is neutral. CME has traded within a volatile $282.94–$289.65 range today, with price action aligned to the downside since the open.
Further downside risk as sideways trading expected near support
Over the next five days, CME is expected to fluctuate within a $275–$290 band, a volatility band relative to current levels that reflects recent downward momentum. The likelihood of a price increase is low, with less than a 20% probability. Sideways trading within this range is the baseline scenario, while further downside could be triggered by a drop below $282.00 and a test of support at $275. A bullish reversal would require a clear break above resistance at $291.31.
Earlier, analysts noted that CME Group maintained an overall uptrend despite mixed technical signals and short-term volatility. Current price action reinforces a near-term bearish bias, making a sustained move below $282.00 a potential trigger for further downside in the days ahead.


Latest CME Group News


-
 Afghanistan
-
 Albania
-
 Algeria
-
 Angola
-
 Argentina
-
 Armenia
-
 Australia
-
 Austria
-
 Azerbaijan
-
 Bahamas
-
 Bahrain
-
 Bangladesh
-
 Belarus
-
 Belgium
-
 Bolivia
-
 Botswana
-
 Brazil
-
 Brunei
-
 Bulgaria
-
 Cambodia
-
 Cameroon
-
 Canada
-
 Chile
Chile
-
 China
China
-
 Colombia
-
 Congo
Congo
-
 Costa Rica
-
 Cote d'Ivoire
-
 Croatia
-
 Cuba
Cuba
-
 Cyprus
-
 Czechia
-
 DR Congo
-
 Denmark
-
 Dominican Republic
-
 Ecuador
-
 Egypt
Egypt
-
 El Salvador
-
 Estonia
-
 Eswatini
-
 Ethiopia
-
 Finland
-
 France
-
 Georgia
-
 Germany
-
 Ghana
Ghana
-
 Greece
-
 Haiti
Haiti
-
 Hong Kong
-
 Hungary
-
 India
India
-
 Indonesia
-
 Iran, Islamic republic
-
 Iraq
Iraq
-
 Ireland
-
 Israel
-
 Italy
Italy
-
 Jamaica
-
 Japan
Japan
-
 Jordan
-
 Kazakhstan
-
 Kenya
Kenya
-
 Korea
Korea
-
 Kuwait
-
 Kyrgyzstan
-
 Laos
Laos
-
 Latvia
-
 Lebanon
-
 Lesotho
-
 Libya
Libya
-
 Lithuania
-
 Luxembourg
-
 Madagascar
-
 Malaysia
-
 Malta
Malta
-
 Mauritius
-
 Mexico
-
 Moldova
-
 Mongolia
-
 Montenegro
-
 Morocco
-
 Mozambique
-
 Myanmar
-
 Namibia
-
 Nepal
Nepal
-
 Netherlands
-
 New Zealand
-
 Nigeria
-
 North Macedonia
-
 Norway
-
 Oman
Oman
-
 Pakistan
-
 Palestine
-
 Panama
-
 Papua New Guinea
-
 Paraguay
-
 Peru
Peru
-
 Philippines
-
 Poland
-
 Portugal
-
 Puerto Rico
-
 Qatar
Qatar
-
 Reunion
-
 Romania
-
 Rwanda
-
 Saudi Arabia
-
 Serbia
-
 Singapore
-
 Slovakia
-
 Slovenia
-
 Somalia
-
 South Africa
-
 Spain
Spain
-
 Sri Lanka
-
 Sweden
-
 Switzerland
-
 Syria
Syria
-
 Taiwan
-
 Tajikistan
-
 Tanzania
-
 Thailand
-
 Trinidad and Tobago
-
 Tunisia
-
 Turkey
-
 UAE
UAE
-
 Uganda
-
 Ukraine
-
 United Kingdom
-
United States
-
 Uruguay
-
 Uzbekistan
-
 Venezuela
-
 Vietnam
-
 Yemen
Yemen
-
 Zambia
-
 Zimbabwe
- Forex
- Crypto
