
Texas Instruments stock drops 3.2% as price hovers near session lows

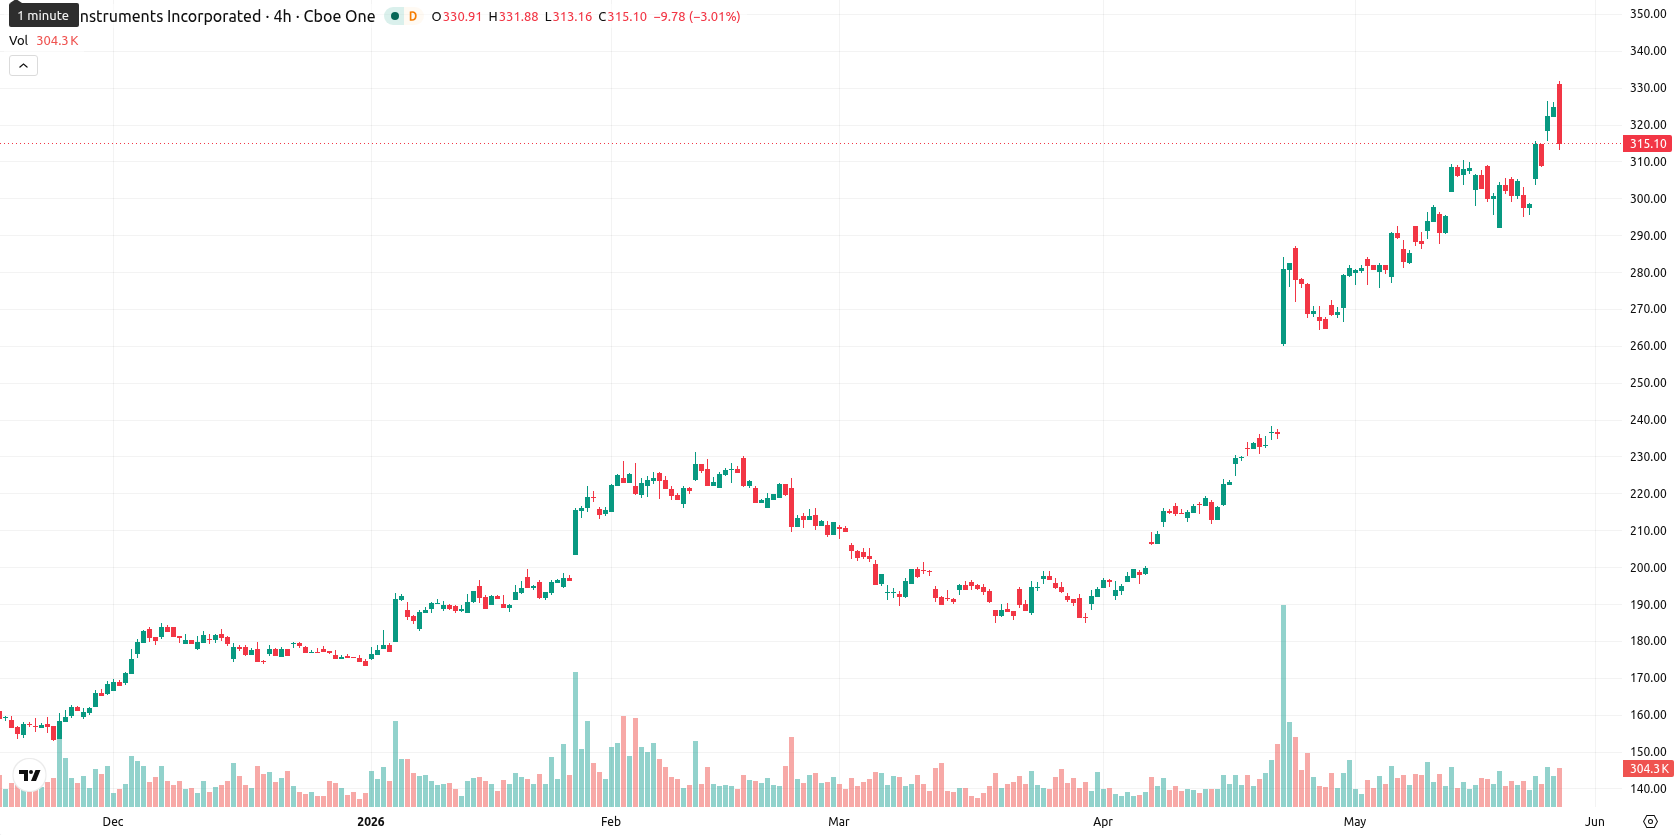
Texas Instruments Incorporated (TXN) stock is trading at $314.48, down 3.20% on the day. The current price remains well above its key moving averages, reflecting prevailing bullish momentum over short, medium, and long-term horizons.
Highlights
- TXN maintains strong bullish momentum across short, medium, and long-term signals after a period of intraday volatility.
- The stock is currently consolidating near $314, close to forecasted short-term support, amid high volatility after a gap-up open.
- Technical indicators suggest overbought conditions but project an 80% probability of price appreciation within a $305–$340 trading range over the next week.
Overbought signals emerge as momentum diverges intraday
On the technical front, TXN trades significantly above the SMA-20 ($293.57), SMA-50 ($244.73), and SMA-200 ($201.42). The Ichimoku Kijun on D1 stands at $278.21, marking an immediate support level. MACD and ADX both indicate continued upward momentum. However, RSI and CCI on the daily chart are at high levels, highlighting overbought conditions, and BBP also confirms buyer dominance earlier in the session. After a gap up at the open ($326.24 vs $324.89), price has fallen to the lower end of today’s volatile range ($313.40–$328.07). Stoch RSI displays mixed signals, oscillating between overbought on higher timeframes and oversold intraday, suggesting a divergence between broader momentum and current selling pressure.
Sideways movement favored as volatility bands limit downside
For the next five trading days, TXN is likely to trade within a volatility band of $305 to $340, placing the current price near the lower end of this range. Based on current technicals, further downside is less probable, with a high likelihood (over 80%) of price stabilization or a bounce. The baseline scenario is sideways consolidation between $305 and $340. If price breaks above $328, a move toward the $340–$345 zone could unfold, while a sustained break below $313 would expose $305 as short-term support.
Earlier, analysts noted that Texas Instruments maintained robust bullish momentum across key timeframes despite some overbought signals. Current price action and technicals reinforce this underlying strength, but traders should closely monitor for signs of a reversal if volatility persists near the $313 support zone.


Latest Texas Instruments News


-
 Afghanistan
-
 Albania
-
 Algeria
-
 Angola
-
 Argentina
-
 Armenia
-
 Australia
-
 Austria
-
 Azerbaijan
-
 Bahamas
-
 Bahrain
-
 Bangladesh
-
 Belarus
-
 Belgium
-
 Bolivia
-
 Botswana
-
 Brazil
-
 Brunei
-
 Bulgaria
-
 Cambodia
-
 Cameroon
-
 Canada
-
 Chile
Chile
-
 China
China
-
 Colombia
-
 Congo
Congo
-
 Costa Rica
-
 Cote d'Ivoire
-
 Croatia
-
 Cuba
Cuba
-
 Cyprus
-
 Czechia
-
 DR Congo
-
 Denmark
-
 Dominican Republic
-
 Ecuador
-
 Egypt
Egypt
-
 El Salvador
-
 Estonia
-
 Eswatini
-
 Ethiopia
-
 Finland
-
 France
-
 Georgia
-
 Germany
-
 Ghana
Ghana
-
 Greece
-
 Haiti
Haiti
-
 Hong Kong
-
 Hungary
-
 India
India
-
 Indonesia
-
 Iran, Islamic republic
-
 Iraq
Iraq
-
 Ireland
-
 Israel
-
 Italy
Italy
-
 Jamaica
-
 Japan
Japan
-
 Jordan
-
 Kazakhstan
-
 Kenya
Kenya
-
 Korea
Korea
-
 Kuwait
-
 Kyrgyzstan
-
 Laos
Laos
-
 Latvia
-
 Lebanon
-
 Lesotho
-
 Libya
Libya
-
 Lithuania
-
 Luxembourg
-
 Madagascar
-
 Malaysia
-
 Malta
Malta
-
 Mauritius
-
 Mexico
-
 Moldova
-
 Mongolia
-
 Montenegro
-
 Morocco
-
 Mozambique
-
 Myanmar
-
 Namibia
-
 Nepal
Nepal
-
 Netherlands
-
 New Zealand
-
 Nigeria
-
 North Macedonia
-
 Norway
-
 Oman
Oman
-
 Pakistan
-
 Palestine
-
 Panama
-
 Papua New Guinea
-
 Paraguay
-
 Peru
Peru
-
 Philippines
-
 Poland
-
 Portugal
-
 Puerto Rico
-
 Qatar
Qatar
-
 Reunion
-
 Romania
-
 Rwanda
-
 Saudi Arabia
-
 Serbia
-
 Singapore
-
 Slovakia
-
 Slovenia
-
 Somalia
-
 South Africa
-
 Spain
Spain
-
 Sri Lanka
-
 Sweden
-
 Switzerland
-
 Syria
Syria
-
 Taiwan
-
 Tajikistan
-
 Tanzania
-
 Thailand
-
 Trinidad and Tobago
-
 Tunisia
-
 Turkey
-
 UAE
UAE
-
 Uganda
-
 Ukraine
-
 United Kingdom
-
United States
-
 Uruguay
-
 Uzbekistan
-
 Venezuela
-
 Vietnam
-
 Yemen
Yemen
-
 Zambia
-
 Zimbabwe
- Forex
- Crypto
