
CME Group stock edges lower as dividend payout maintains status quo

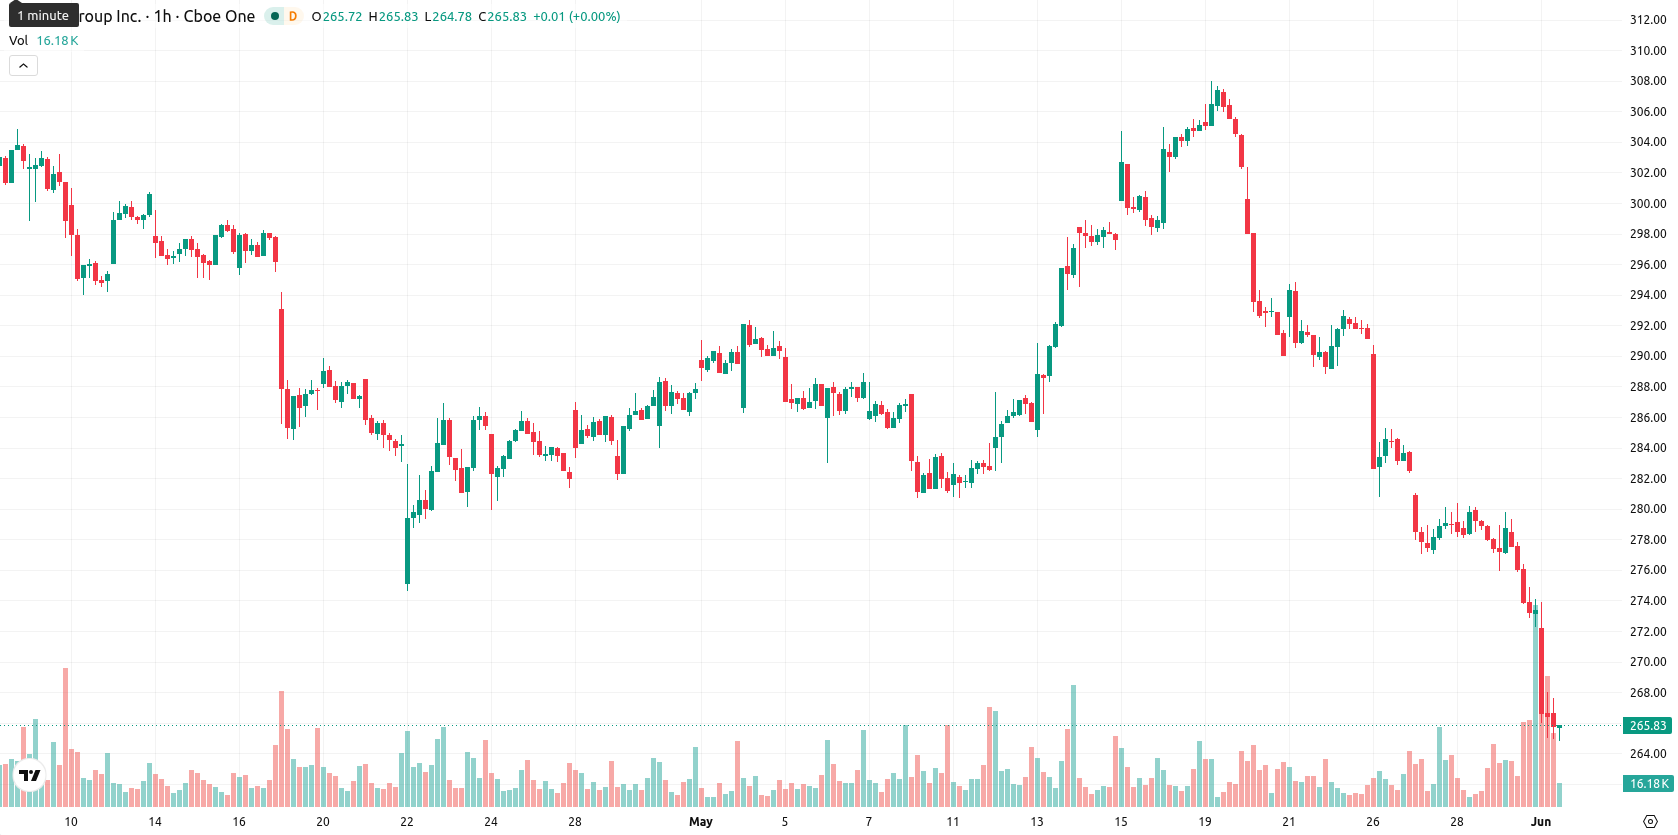
CME Group Inc. (CME) stock is trading at $265.06, down 3.10% for the day. The price sits well below its key moving averages, highlighting ongoing downward momentum in recent sessions.
Highlights
- Savant Capital LLC sharply reduced its CME Group stake by 67.4% in Q4, signaling notable institutional repositioning and the potential for increased selling pressure.
- CME Group maintains a low debt-to-equity ratio of 0.13 with strong liquidity and continues its regular dividend payout, supporting operational stability.
- CME trades below major moving averages with widespread momentum weakness, and is expected to remain between $260 and $272, with a clear bearish trend prevailing.
Institutional selling accelerates as dividend and liquidity provide contrast
Savant Capital LLC reduced its stake in CME by 67.4% during the fourth quarter, selling 38,072 shares and now holding 18,392, representing a sharp cut by a notable institutional holder; such moves can prompt additional selling as market liquidity reacts to changing portfolio allocations. CME Group also declared a quarterly dividend to be paid on June 25, ensuring a continued payout stream that offers shareholders a degree of expected capital return. The company's financial ratios, with a low debt-to-equity level of 0.13 and strong liquidity, confirm solid underlying operational health alongside these developments.
Oversold momentum dominates as sellers maintain control below support
Technically, CME trades beneath the SMA-20 at $288.79, the SMA-50 at $292.95, and the SMA-200 at $282.63. Immediate resistance is identified near the D1 Ichimoku Kijun at $290.37, while the $260.00 level marks critical support. The MACD maintains a clear sell bias and the ADX signals a moderate downtrend. Momentum oscillators including RSI, CCI, and Stoch RSI all show oversold conditions, while Bull/Bear Power (BBP) at -5.96 and Awesome Oscillator both reinforce the prevailing seller dominance and downward momentum throughout the session. The last trade near today’s intraday low, following a marginal gap down at the open, reflects sharp volatility and sustained downside pressure since the start of trading.
Rebound odds low unless resistance breaks amid defined trading range
Over the coming five sessions, CME is expected to fluctuate within a volatility band of $260.00 to $272.00, with a less than 20% probability of a material rebound. The baseline scenario is for price stabilization within this corridor. Should the $290.37 resistance be breached, a bullish impulse could develop, while a decisive move below $260.00 would likely deepen the ongoing downtrend.
Previously it was reported that CME Group expanded its crypto futures and options to 24/7 trading, removing structural barriers for institutional participants. While this innovation enhanced market access, the current technical and flow-based pressures on CME shares highlight that stock volatility remains driven by broader sentiment shifts—traders should monitor the $260.00 floor as a critical decision level in the coming sessions.


Latest CME Group News


-
 Afghanistan
-
 Albania
-
 Algeria
-
 Angola
-
 Argentina
-
 Armenia
-
 Australia
-
 Austria
-
 Azerbaijan
-
 Bahamas
-
 Bahrain
-
 Bangladesh
-
 Belarus
-
 Belgium
-
 Bolivia
-
 Botswana
-
 Brazil
-
 Brunei
-
 Bulgaria
-
 Cambodia
-
 Cameroon
-
 Canada
-
 Chile
Chile
-
 China
China
-
 Colombia
-
 Congo
Congo
-
 Costa Rica
-
 Cote d'Ivoire
-
 Croatia
-
 Cuba
Cuba
-
 Cyprus
-
 Czechia
-
 DR Congo
-
 Denmark
-
 Dominican Republic
-
 Ecuador
-
 Egypt
Egypt
-
 El Salvador
-
 Estonia
-
 Eswatini
-
 Ethiopia
-
 Finland
-
 France
-
 Georgia
-
 Germany
-
 Ghana
Ghana
-
 Greece
-
 Haiti
Haiti
-
 Hong Kong
-
 Hungary
-
 India
India
-
 Indonesia
-
 Iran, Islamic republic
-
 Iraq
Iraq
-
 Ireland
-
 Israel
-
 Italy
Italy
-
 Jamaica
-
 Japan
Japan
-
 Jordan
-
 Kazakhstan
-
 Kenya
Kenya
-
 Korea
Korea
-
 Kuwait
-
 Kyrgyzstan
-
 Laos
Laos
-
 Latvia
-
 Lebanon
-
 Lesotho
-
 Libya
Libya
-
 Lithuania
-
 Luxembourg
-
 Madagascar
-
 Malaysia
-
 Malta
Malta
-
 Mauritius
-
 Mexico
-
 Moldova
-
 Mongolia
-
 Montenegro
-
 Morocco
-
 Mozambique
-
 Myanmar
-
 Namibia
-
 Nepal
Nepal
-
 Netherlands
-
 New Zealand
-
 Nigeria
-
 North Macedonia
-
 Norway
-
 Oman
Oman
-
 Pakistan
-
 Palestine
-
 Panama
-
 Papua New Guinea
-
 Paraguay
-
 Peru
Peru
-
 Philippines
-
 Poland
-
 Portugal
-
 Puerto Rico
-
 Qatar
Qatar
-
 Reunion
-
 Romania
-
 Rwanda
-
 Saudi Arabia
-
 Serbia
-
 Singapore
-
 Slovakia
-
 Slovenia
-
 Somalia
-
 South Africa
-
 Spain
Spain
-
 Sri Lanka
-
 Sweden
-
 Switzerland
-
 Syria
Syria
-
 Taiwan
-
 Tajikistan
-
 Tanzania
-
 Thailand
-
 Trinidad and Tobago
-
 Tunisia
-
 Turkey
-
 UAE
UAE
-
 Uganda
-
 Ukraine
-
 United Kingdom
-
United States
-
 Uruguay
-
 Uzbekistan
-
 Venezuela
-
 Vietnam
-
 Yemen
Yemen
-
 Zambia
-
 Zimbabwe
- Forex
- Crypto
