
Nano Dimension stock falls as upside capped by $1.73 resistance zone

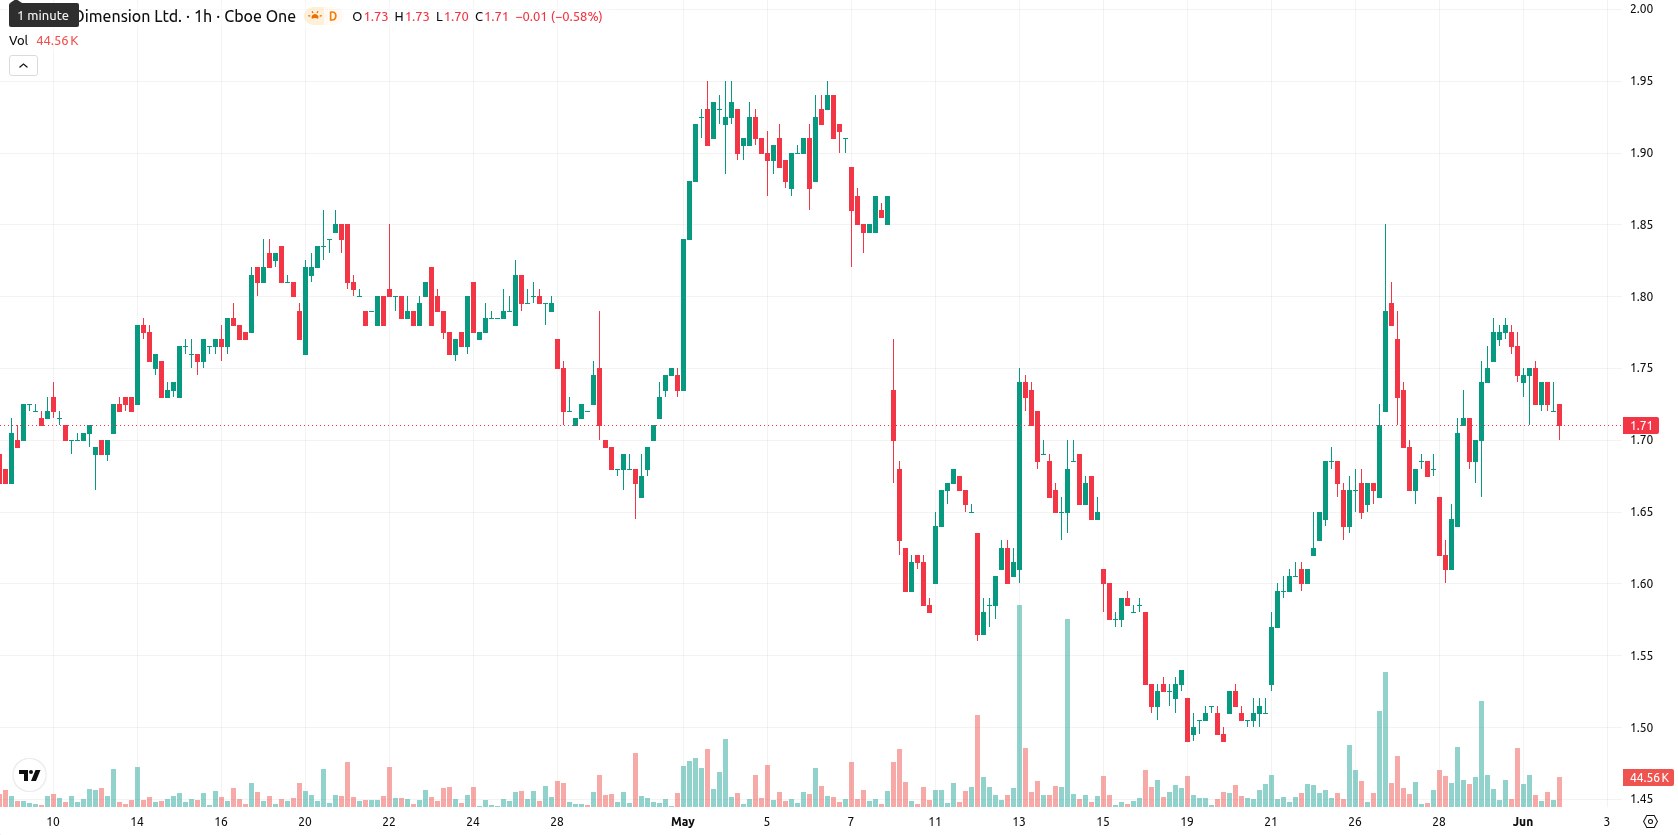
Nano Dimension (NNDM) stock is trading at $1.71, reflecting a 2.29% decline on the day. The price sits slightly above its short-term averages, occupying a pivotal area as constructive momentum competes with persistent medium-term selling pressure.
Highlights
- NNDM is trading near a pivotal support zone, hovering just above its long-term support and testing immediate resistance at $1.73.
- Momentum and oscillators provide mixed signals, with weak bullish undertones offset by renewed downside pressure and signs of overbought conditions.
- A sideways trading range between $1.64 and $1.73 is likely next week, with a sub-20% probability of near-term price gains.
Resistance at kijun persists amid mixed trend signals
The $1.71 level sits just above the MA-20 ($1.69) and MA-200 ($1.70), but fractionally below the MA-50 ($1.72). Price action remains boxed in below the daily Ichimoku Kijun at $1.73, which serves as immediate resistance. Intraday, the low of $1.70 highlights emerging support, while the $1.73–$1.76 zone marks clear upside hurdles. Momentum signals are mixed: MACD gives a strong daily sell, ADX is neutral with weak trend intensity, RSI at 51.02 is stable near mid-range, Stoch RSI flags overbought downside risk, CCI is flat, and BBP reflects ongoing but mild buyer presence. The Awesome Oscillator displays a lack of clear trend direction.
Downside risk outweighs as tight range caps upside
Given recent price dynamics, typical volatility suggests NNDM will fluctuate within a $1.64–$1.73 band over the coming week. Short-term risk tilts toward further declines, with less than a 20% likelihood of an upside breakout. A sustained move above $1.73 could initiate a test of the $1.76 region, while a close below $1.70 would expose the $1.64 support area as a next downside target.
Earlier, analysts noted that Nano Dimension was consolidating in a neutral-to-bullish posture, but lacked clear momentum for a decisive breakout. The current analysis adds that, with intraday signals remaining mixed and volatility persistent, traders should monitor the $1.70 support and $1.73 resistance as potential catalysts for a move outside of the recent trading range.


Latest Nano Dimension News


-
 Afghanistan
-
 Albania
-
 Algeria
-
 Angola
-
 Argentina
-
 Armenia
-
 Australia
-
 Austria
-
 Azerbaijan
-
 Bahamas
-
 Bahrain
-
 Bangladesh
-
 Belarus
-
 Belgium
-
 Bolivia
-
 Botswana
-
 Brazil
-
 Brunei
-
 Bulgaria
-
 Cambodia
-
 Cameroon
-
 Canada
-
 Chile
Chile
-
 China
China
-
 Colombia
-
 Congo
Congo
-
 Costa Rica
-
 Cote d'Ivoire
-
 Croatia
-
 Cuba
Cuba
-
 Cyprus
-
 Czechia
-
 DR Congo
-
 Denmark
-
 Dominican Republic
-
 Ecuador
-
 Egypt
Egypt
-
 El Salvador
-
 Estonia
-
 Eswatini
-
 Ethiopia
-
 Finland
-
 France
-
 Georgia
-
 Germany
-
 Ghana
Ghana
-
 Greece
-
 Haiti
Haiti
-
 Hong Kong
-
 Hungary
-
 India
India
-
 Indonesia
-
 Iran, Islamic republic
-
 Iraq
Iraq
-
 Ireland
-
 Israel
-
 Italy
Italy
-
 Jamaica
-
 Japan
Japan
-
 Jordan
-
 Kazakhstan
-
 Kenya
Kenya
-
 Korea
Korea
-
 Kuwait
-
 Kyrgyzstan
-
 Laos
Laos
-
 Latvia
-
 Lebanon
-
 Lesotho
-
 Libya
Libya
-
 Lithuania
-
 Luxembourg
-
 Madagascar
-
 Malaysia
-
 Malta
Malta
-
 Mauritius
-
 Mexico
-
 Moldova
-
 Mongolia
-
 Montenegro
-
 Morocco
-
 Mozambique
-
 Myanmar
-
 Namibia
-
 Nepal
Nepal
-
 Netherlands
-
 New Zealand
-
 Nigeria
-
 North Macedonia
-
 Norway
-
 Oman
Oman
-
 Pakistan
-
 Palestine
-
 Panama
-
 Papua New Guinea
-
 Paraguay
-
 Peru
Peru
-
 Philippines
-
 Poland
-
 Portugal
-
 Puerto Rico
-
 Qatar
Qatar
-
 Reunion
-
 Romania
-
 Rwanda
-
 Saudi Arabia
-
 Serbia
-
 Singapore
-
 Slovakia
-
 Slovenia
-
 Somalia
-
 South Africa
-
 Spain
Spain
-
 Sri Lanka
-
 Sweden
-
 Switzerland
-
 Syria
Syria
-
 Taiwan
-
 Tajikistan
-
 Tanzania
-
 Thailand
-
 Trinidad and Tobago
-
 Tunisia
-
 Turkey
-
 UAE
UAE
-
 Uganda
-
 Ukraine
-
 United Kingdom
-
United States
-
 Uruguay
-
 Uzbekistan
-
 Venezuela
-
 Vietnam
-
 Yemen
Yemen
-
 Zambia
-
 Zimbabwe
- Forex
- Crypto
