
SoFi stock drops as price holds above moving averages but buying fades

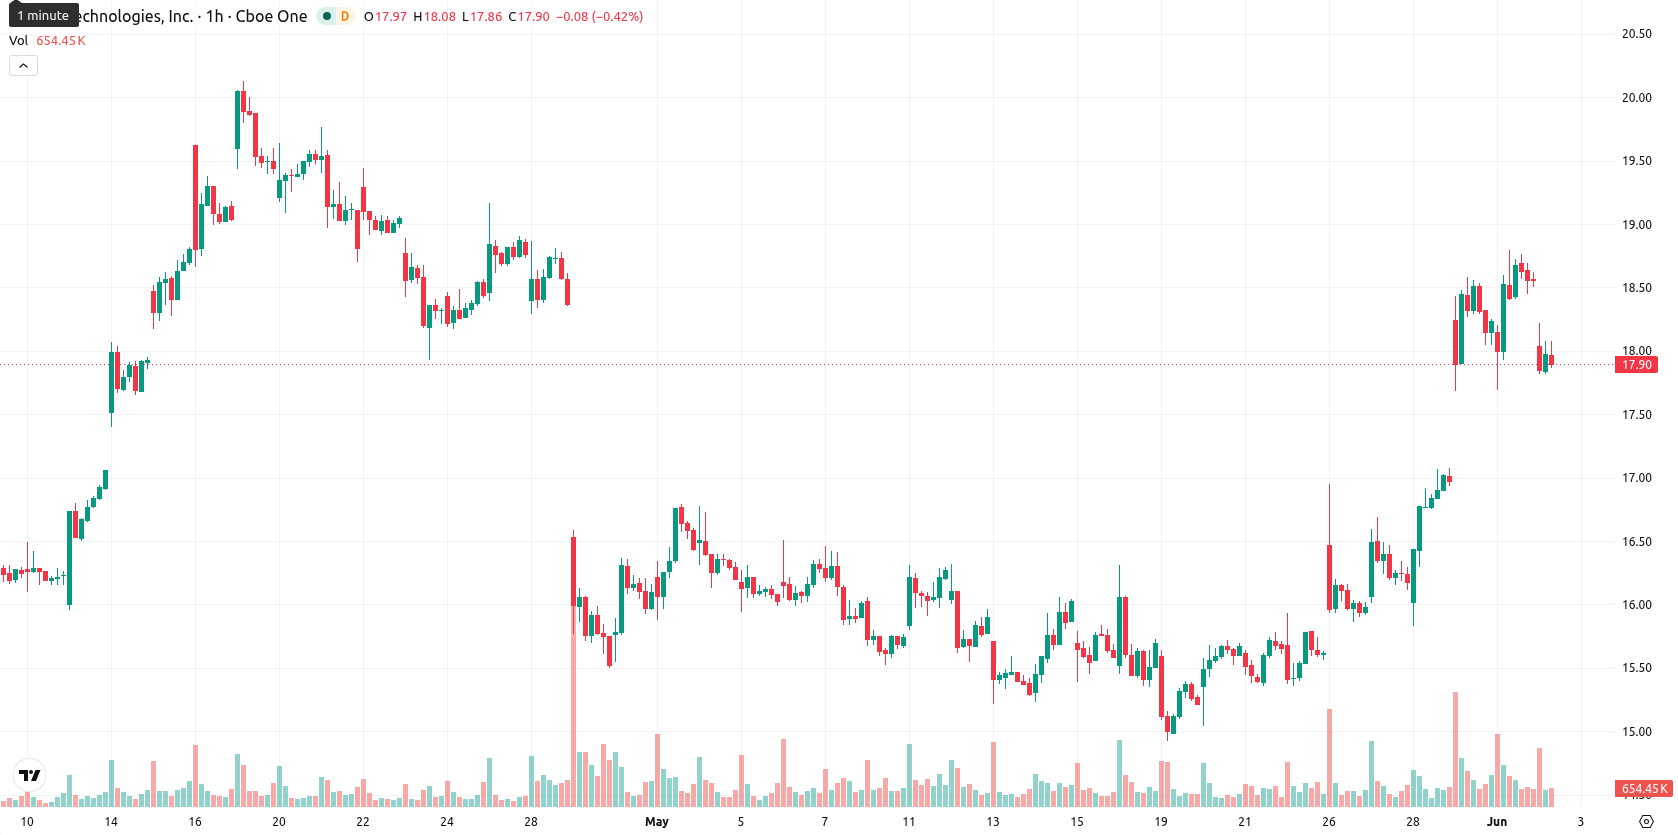
SoFi Technologies, Inc. (SOFI) stock is trading at $17.97, down 3.34% for the day. The price remains above its key moving averages, reflecting continued short- and medium-term strength, but it has slipped below this session’s open and is showing intraday weakness.
 19.15
19.12
19.15
19.12
Highlights
- SoFi Technologies unveiled SoFiUSD, the first stablecoin issued by a U.S. national bank, embedding digital assets into its core banking platform.
- First quarter 2026 saw SoFi generate net revenue of $1.1 billion and net income of $166.7 million, with membership reaching 14.7 million.
- Despite recent bullish momentum and overbought signals, SOFI faces short-term downside risk with projected consolidation between $16.20 and $18.50.
Stablecoin debut and strong earnings offset by persistent selling pressure
SoFi Technologies launched SoFiUSD, the first stablecoin issued by a U.S. national bank, directly integrating digital asset capabilities into its core banking platform for almost 15 million members. The company reported first quarter 2026 financial results, registering net revenue of $1.1 billion and net income of $166.7 million, which underscores improved profitability and operational scale. Additional developments included member growth to 14.7 million and the rollout of SoFi Coach, an AI-driven financial guidance tool for Plus-tier users, though price action has remained under broader selling pressure.
Bullish undertones face short-term risk as mixed indicators signal vulnerability
Technical analysis highlights the SMA-20 at $16.16, the SMA-50 at $16.74, and the SMA-200 positioned much higher at $23.19. Immediate short-term support is observed at the Ichimoku Kijun level of $17.05, placing a floor just below current levels. On momentum indicators, both MACD and ADX remain neutral, while the RSI prints a strong reading of 66. The CCI and BBP indicate overbought and buyer-dominated conditions, with Stoch RSI and CCI both flagging the risk of exhaustion in the near term. The Awesome Oscillator aligns with a continuation of upside momentum, yet today’s gap-down opening and weakness toward the lower end of the session’s range reflect active intraday volatility and downside pressure. Overall, conflicting signals between trending and oscillating indicators highlight a short-term vulnerability amid prevailing bullish undertones.
Downside risk dominates as rebound odds remain limited
Over the next five days, SOFI is likely to trade within a typical volatility band spanning $16.20 to $18.50. The probability of a near-term rebound is low—less than 20%—so further downward movement remains the primary risk scenario. Baseline expectations call for consolidation around current levels; a decisive break above $18.50 could trigger renewed buying toward recent highs, whereas a sustained dip below $16.20 would open the way to deeper losses and subsequent support targeting.
Earlier, analysts noted that SoFi's innovative moves in digital banking, including its stablecoin launch, were supported by overall bullish momentum but tempered by technical signals suggesting near-term consolidation. The current landscape further highlights this tension, as prevailing volatility and overbought conditions reinforce the need to monitor for a potential shift in trend should downside risk materialize below short-term support.



Latest SoFi News






-
 Afghanistan
-
 Albania
-
 Algeria
-
 Angola
-
 Argentina
-
 Armenia
-
 Australia
-
 Austria
-
 Azerbaijan
-
 Bahamas
-
 Bahrain
-
 Bangladesh
-
 Belarus
-
 Belgium
-
 Bolivia
-
 Botswana
-
 Brazil
-
 Brunei
-
 Bulgaria
-
 Cambodia
-
 Cameroon
-
 Canada
-
 Chile
Chile
-
 China
China
-
 Colombia
-
 Congo
Congo
-
 Costa Rica
-
 Cote d'Ivoire
-
 Croatia
-
 Cuba
Cuba
-
 Cyprus
-
 Czechia
-
 DR Congo
-
 Denmark
-
 Dominican Republic
-
 Ecuador
-
 Egypt
Egypt
-
 El Salvador
-
 Estonia
-
 Eswatini
-
 Ethiopia
-
 Finland
-
 France
-
 Georgia
-
 Germany
-
 Ghana
Ghana
-
 Greece
-
 Haiti
Haiti
-
 Hong Kong
-
 Hungary
-
 India
India
-
 Indonesia
-
 Iran, Islamic republic
-
 Iraq
Iraq
-
 Ireland
-
 Israel
-
 Italy
Italy
-
 Jamaica
-
 Japan
Japan
-
 Jordan
-
 Kazakhstan
-
 Kenya
Kenya
-
 Korea
Korea
-
 Kuwait
-
 Kyrgyzstan
-
 Laos
Laos
-
 Latvia
-
 Lebanon
-
 Lesotho
-
 Libya
Libya
-
 Lithuania
-
 Luxembourg
-
 Madagascar
-
 Malaysia
-
 Malta
Malta
-
 Mauritius
-
 Mexico
-
 Moldova
-
 Mongolia
-
 Montenegro
-
 Morocco
-
 Mozambique
-
 Myanmar
-
 Namibia
-
 Nepal
Nepal
-
 Netherlands
-
 New Zealand
-
 Nigeria
-
 North Macedonia
-
 Norway
-
 Oman
Oman
-
 Pakistan
-
 Palestine
-
 Panama
-
 Papua New Guinea
-
 Paraguay
-
 Peru
Peru
-
 Philippines
-
 Poland
-
 Portugal
-
 Puerto Rico
-
 Qatar
Qatar
-
 Reunion
-
 Romania
-
 Rwanda
-
 Saudi Arabia
-
 Serbia
-
 Singapore
-
 Slovakia
-
 Slovenia
-
 Somalia
-
 South Africa
-
 Spain
Spain
-
 Sri Lanka
-
 Sweden
-
 Switzerland
-
 Syria
Syria
-
 Taiwan
-
 Tajikistan
-
 Tanzania
-
 Thailand
-
 Trinidad and Tobago
-
 Tunisia
-
 Turkey
-
 UAE
UAE
-
 Uganda
-
 Ukraine
-
 United Kingdom
-
United States
-
 Uruguay
-
 Uzbekistan
-
 Venezuela
-
 Vietnam
-
 Yemen
Yemen
-
 Zambia
-
 Zimbabwe
- Forex
- Crypto











