
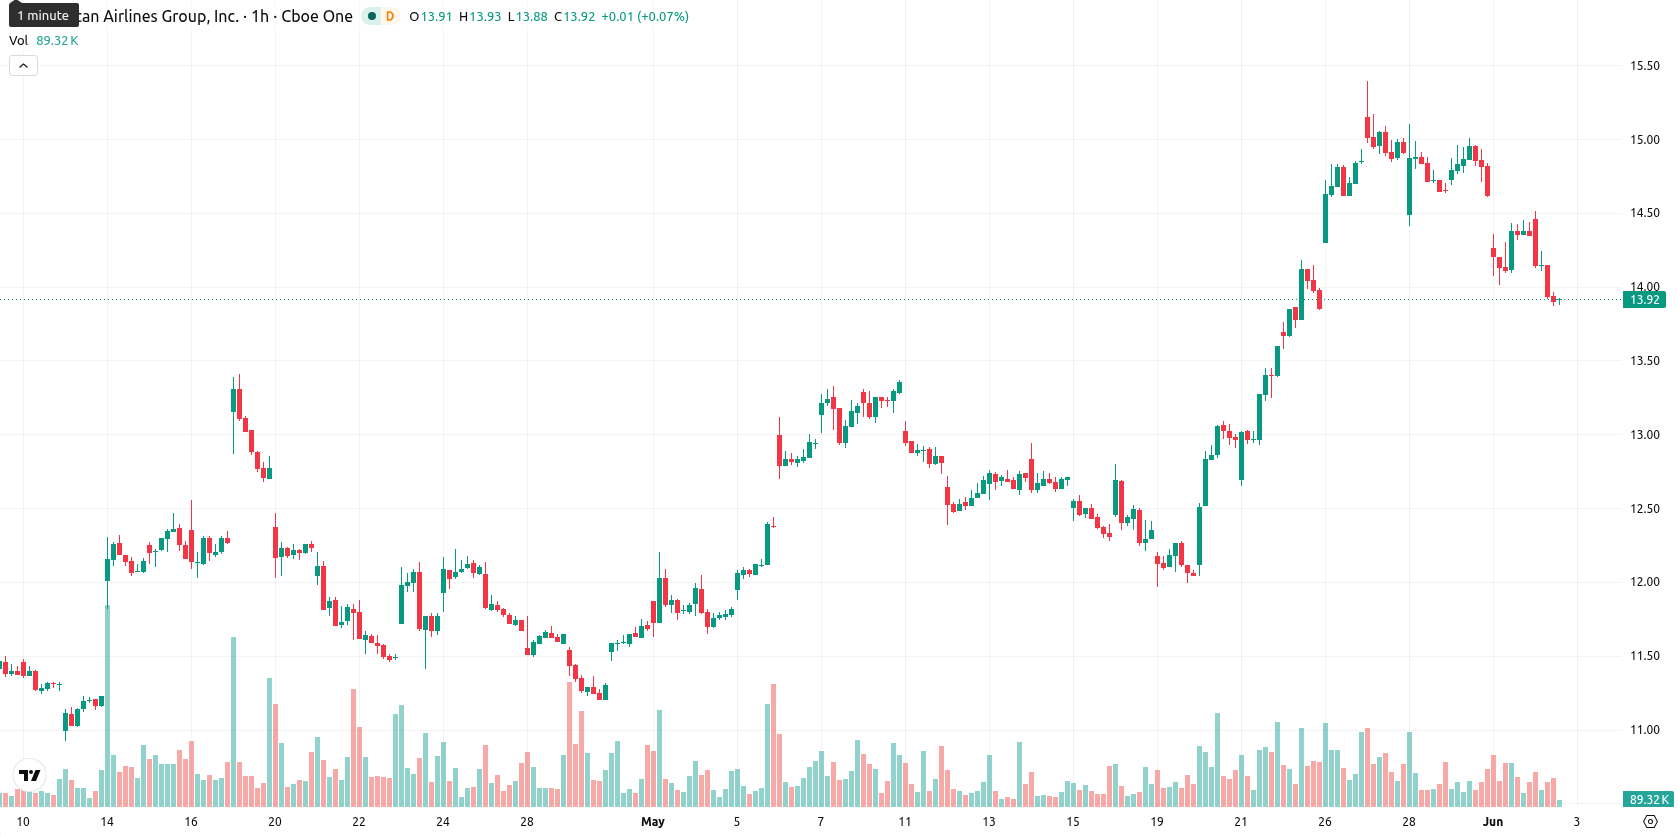
American Airlines stock price forecast: $13.60 support as AAL slips 3% toward key level

American Airlines Group (AAL) stock is trading at $13.91, down 3.00% from the previous session. The price currently sits above its key moving averages, reflecting near-term positive momentum despite the daily decline.
Highlights
- AAL is trading above key moving averages, signaling sustained bullish momentum across short, medium, and long-term timeframes.
- Intraday downside pressure contradicts broader positive signals, with the price near daily lows after a 3% drop and moderate to high volatility.
- Expected five-day range is $13.60 to $14.70, with the probability of a breakout or breakdown appearing evenly balanced.
Bullish bias holds over support as intraday volatility rises
On the technical side, AAL is trading above the SMA-20 ($13.25), SMA-50 ($12.11), and SMA-200 ($13.06). The Ichimoku Kijun level on the daily chart stands at $13.29 and acts as immediate support below the current price. The session's range has been $13.88 to $14.51, with current price holding near the daily low after moderate to high intraday volatility. Momentum indicators are mixed: MACD and ADX both suggest bullish momentum, while RSI (64.49), CCI (85.82), and Stoch RSI (65.03) all reflect neutral positioning—neither overbought nor oversold. The Bull/Bear Power (BBP) at 0.66 indicates recent buying activity, but the Awesome Oscillator remains neutral.
Range-bound outlook persists as technical signals remain mixed
Over the next five trading days, AAL is expected to trade in a band between $13.60 and $14.70, reflecting typical volatility relative to current pricing. Weekly signals show a moderately balanced outlook, with the MA-50-weekly and RSI-weekly in buy territory, and both MACD-weekly and ADX-weekly remaining neutral. The baseline expectation calls for range-bound action between support at $13.60 and resistance at $14.70. Should AAL break above $14.70, a bullish breakout scenario could develop, while a close below $13.60 might signal a downside move.
Earlier, analysts noted a cautiously optimistic technical outlook for American Airlines, highlighting positive momentum but warning of short-term retracement risks due to overbought conditions. The latest developments reinforce this balanced stance, as current technical readings suggest traders should watch for a potential range-bound phase and monitor $13.60 as a key support level in the days ahead.


Latest American Airlines News


-
 Afghanistan
-
 Albania
-
 Algeria
-
 Angola
-
 Argentina
-
 Armenia
-
 Australia
-
 Austria
-
 Azerbaijan
-
 Bahamas
-
 Bahrain
-
 Bangladesh
-
 Belarus
-
 Belgium
-
 Bolivia
-
 Botswana
-
 Brazil
-
 Brunei
-
 Bulgaria
-
 Cambodia
-
 Cameroon
-
 Canada
-
 Chile
Chile
-
 China
China
-
 Colombia
-
 Congo
Congo
-
 Costa Rica
-
 Cote d'Ivoire
-
 Croatia
-
 Cuba
Cuba
-
 Cyprus
-
 Czechia
-
 DR Congo
-
 Denmark
-
 Dominican Republic
-
 Ecuador
-
 Egypt
Egypt
-
 El Salvador
-
 Estonia
-
 Eswatini
-
 Ethiopia
-
 Finland
-
 France
-
 Georgia
-
 Germany
-
 Ghana
Ghana
-
 Greece
-
 Haiti
Haiti
-
 Hong Kong
-
 Hungary
-
 India
India
-
 Indonesia
-
 Iran, Islamic republic
-
 Iraq
Iraq
-
 Ireland
-
 Israel
-
 Italy
Italy
-
 Jamaica
-
 Japan
Japan
-
 Jordan
-
 Kazakhstan
-
 Kenya
Kenya
-
 Korea
Korea
-
 Kuwait
-
 Kyrgyzstan
-
 Laos
Laos
-
 Latvia
-
 Lebanon
-
 Lesotho
-
 Libya
Libya
-
 Lithuania
-
 Luxembourg
-
 Madagascar
-
 Malaysia
-
 Malta
Malta
-
 Mauritius
-
 Mexico
-
 Moldova
-
 Mongolia
-
 Montenegro
-
 Morocco
-
 Mozambique
-
 Myanmar
-
 Namibia
-
 Nepal
Nepal
-
 Netherlands
-
 New Zealand
-
 Nigeria
-
 North Macedonia
-
 Norway
-
 Oman
Oman
-
 Pakistan
-
 Palestine
-
 Panama
-
 Papua New Guinea
-
 Paraguay
-
 Peru
Peru
-
 Philippines
-
 Poland
-
 Portugal
-
 Puerto Rico
-
 Qatar
Qatar
-
 Reunion
-
 Romania
-
 Rwanda
-
 Saudi Arabia
-
 Serbia
-
 Singapore
-
 Slovakia
-
 Slovenia
-
 Somalia
-
 South Africa
-
 Spain
Spain
-
 Sri Lanka
-
 Sweden
-
 Switzerland
-
 Syria
Syria
-
 Taiwan
-
 Tajikistan
-
 Tanzania
-
 Thailand
-
 Trinidad and Tobago
-
 Tunisia
-
 Turkey
-
 UAE
UAE
-
 Uganda
-
 Ukraine
-
 United Kingdom
-
United States
-
 Uruguay
-
 Uzbekistan
-
 Venezuela
-
 Vietnam
-
 Yemen
Yemen
-
 Zambia
-
 Zimbabwe
- Forex
- Crypto
