
Broadcom stock price forecast: $381.67 support in focus as AVGO falls 10.73%

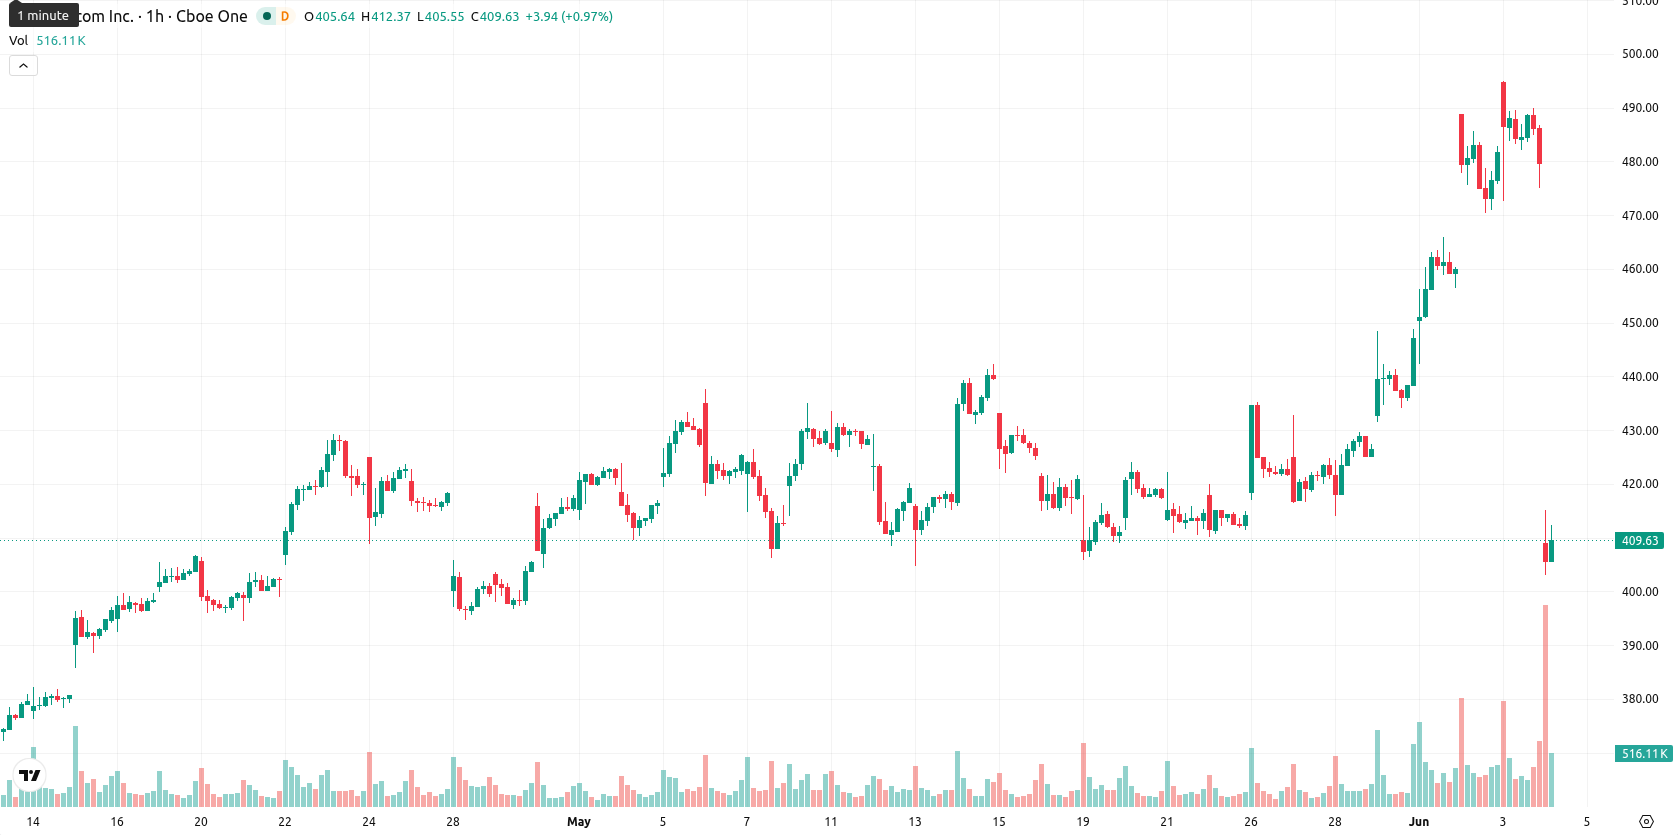
Broadcom Inc. (AVGO) stock is trading at $406.60, down 10.73% on the day. The price sits below its short- and medium-term key moving averages but remains above its longer-term average.
Highlights
- Broadcom reported Q2 FY26 revenue surged 48% year-over-year to $22.19 billion, with net income reaching $9.31 billion.
- AI segment revenue hit $10.8 billion, underscoring Broadcom’s rapid expansion in advanced technology markets despite lowered share buybacks.
- AVGO is trading under key short-term technical levels amid strong seller pressure, with price likely consolidating between $381.67 and $456.75 and risks skewed to downside.
Surging AI revenue drives growth as buybacks decline
Broadcom reported its second-quarter fiscal year 2026 results, posting revenue of $22.19 billion, a 48% year-over-year increase, and GAAP net income of $9.31 billion. This period also saw the announcement of a quarterly dividend and disclosed AI segment revenue of $10.8 billion, highlighting the company's ongoing growth in advanced technology markets. Despite ending the quarter with $19.6 billion in cash and maintaining capital distributions through dividends, the company reported a significant decrease in buybacks compared to previous quarters.
Intense selling momentum persists amid mixed technical signals
On the daily chart, AVGO is below both the MA-20 ($471.51) and MA-50 ($445.98), while still above the MA-200 ($354.62). The Ichimoku Kijun level at $449.03 marks immediate resistance. Near-term technical range is established with $381.67 as support and $456.75 as upper resistance. MACD continues to signal Strong Buy, while ADX points to a Sell. RSI stands at 24.47, and oscillators like Stoch RSI, CCI, and BBP show persistent oversold or seller-dominated conditions, whereas the Awesome Oscillator is neutral. This marks ongoing sharp downside momentum and indicator divergence.
Consolidation range persists as rebound odds remain subdued
In the short term, AVGO is expected to consolidate between $381.67 and $456.75 as the typical volatility band relative to current levels. The probability of a rebound is just 29%, with the base case remaining a sideways or slightly downward bias within this corridor. A breakout above $449.03 would be the trigger for a bullish scenario, while a sustained move below $381.67 would likely confirm renewed selling momentum.
Earlier, analysts noted that Broadcom shares declined sharply following earnings as investors questioned whether the company's AI-driven growth could continue to surpass high expectations. The current technical setup suggests traders should monitor the $449.03 level for signs of bullish reversal, as a sustained break above this resistance may alter the currently cautious outlook.


Latest Broadcom News


-
 Afghanistan
-
 Albania
-
 Algeria
-
 Angola
-
 Argentina
-
 Armenia
-
 Australia
-
 Austria
-
 Azerbaijan
-
 Bahamas
-
 Bahrain
-
 Bangladesh
-
 Belarus
-
 Belgium
-
 Bolivia
-
 Botswana
-
 Brazil
-
 Brunei
-
 Bulgaria
-
 Cambodia
-
 Cameroon
-
 Canada
-
 Chile
Chile
-
 China
China
-
 Colombia
-
 Congo
Congo
-
 Costa Rica
-
 Cote d'Ivoire
-
 Croatia
-
 Cuba
Cuba
-
 Cyprus
-
 Czechia
-
 DR Congo
-
 Denmark
-
 Dominican Republic
-
 Ecuador
-
 Egypt
Egypt
-
 El Salvador
-
 Estonia
-
 Eswatini
-
 Ethiopia
-
 Finland
-
 France
-
 Georgia
-
 Germany
-
 Ghana
Ghana
-
 Greece
-
 Haiti
Haiti
-
 Hong Kong
-
 Hungary
-
 India
India
-
 Indonesia
-
 Iran, Islamic republic
-
 Iraq
Iraq
-
 Ireland
-
 Israel
-
 Italy
Italy
-
 Jamaica
-
 Japan
Japan
-
 Jordan
-
 Kazakhstan
-
 Kenya
Kenya
-
 Korea
Korea
-
 Kuwait
-
 Kyrgyzstan
-
 Laos
Laos
-
 Latvia
-
 Lebanon
-
 Lesotho
-
 Libya
Libya
-
 Lithuania
-
 Luxembourg
-
 Madagascar
-
 Malaysia
-
 Malta
Malta
-
 Mauritius
-
 Mexico
-
 Moldova
-
 Mongolia
-
 Montenegro
-
 Morocco
-
 Mozambique
-
 Myanmar
-
 Namibia
-
 Nepal
Nepal
-
 Netherlands
-
 New Zealand
-
 Nigeria
-
 North Macedonia
-
 Norway
-
 Oman
Oman
-
 Pakistan
-
 Palestine
-
 Panama
-
 Papua New Guinea
-
 Paraguay
-
 Peru
Peru
-
 Philippines
-
 Poland
-
 Portugal
-
 Puerto Rico
-
 Qatar
Qatar
-
 Reunion
-
 Romania
-
 Rwanda
-
 Saudi Arabia
-
 Serbia
-
 Singapore
-
 Slovakia
-
 Slovenia
-
 Somalia
-
 South Africa
-
 Spain
Spain
-
 Sri Lanka
-
 Sweden
-
 Switzerland
-
 Syria
Syria
-
 Taiwan
-
 Tajikistan
-
 Tanzania
-
 Thailand
-
 Trinidad and Tobago
-
 Tunisia
-
 Turkey
-
 UAE
UAE
-
 Uganda
-
 Ukraine
-
 United Kingdom
-
United States
-
 Uruguay
-
 Uzbekistan
-
 Venezuela
-
 Vietnam
-
 Yemen
Yemen
-
 Zambia
-
 Zimbabwe
- Forex
- Crypto
