
-2.82% for Tesla stock as downward momentum persists

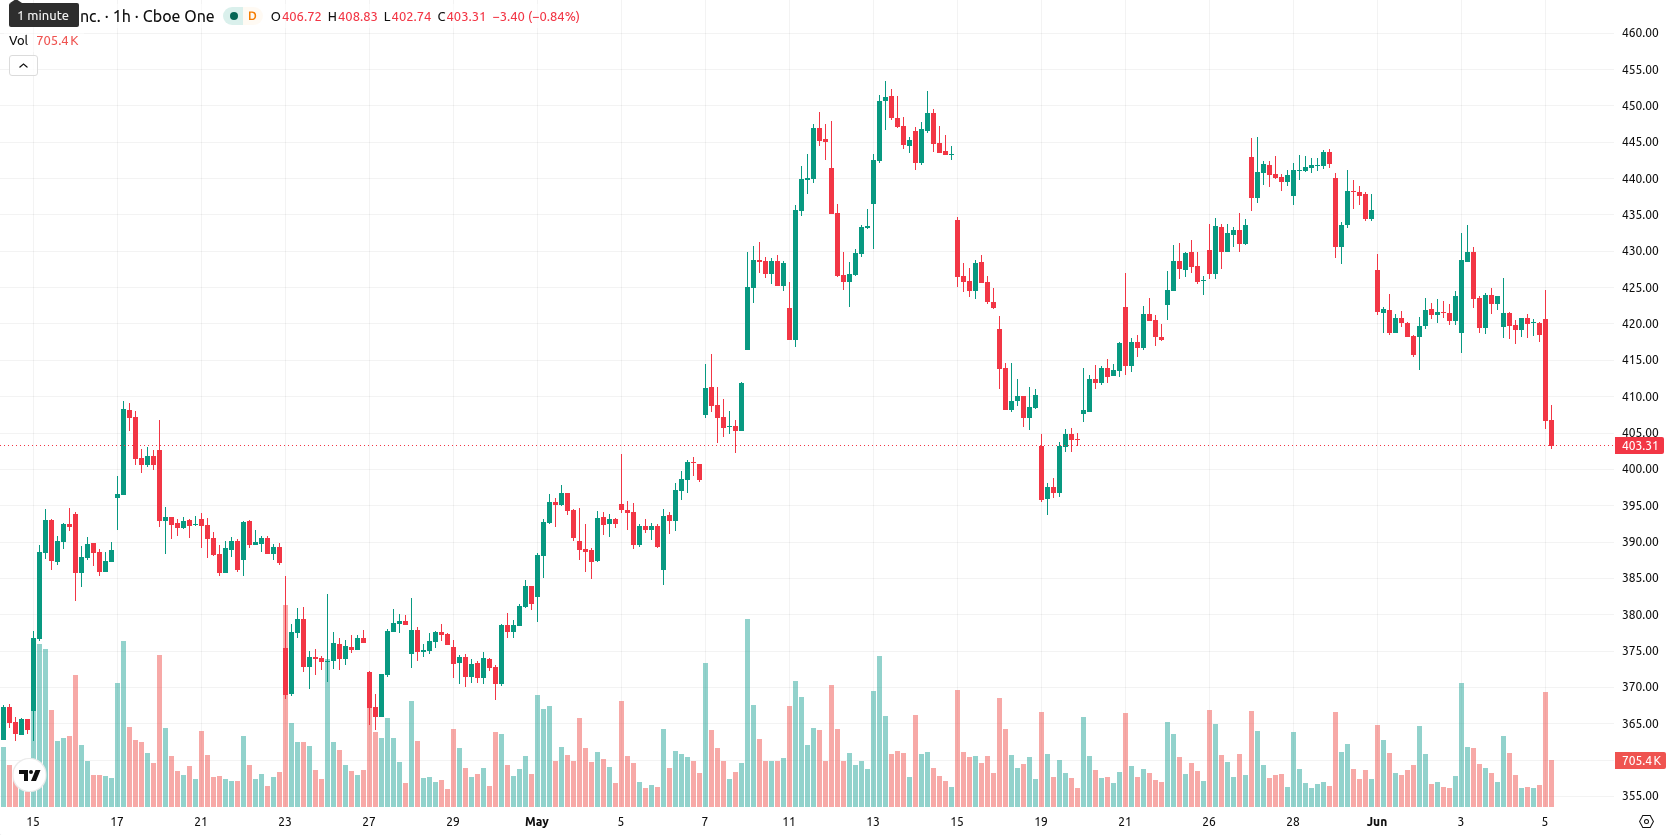
Tesla Inc. (TSLA) stock is trading at $405.90 after a daily move down of 2.82%. The price sits below its key moving averages, indicating persistent pressure from sellers.
 413.06
420.00
413.06
420.00
Highlights
- TSLA/USD remains under pressure, trading below key short-, medium-, and long-term moving averages, signalling continued bearish sentiment.
- Momentum and oscillator signals show dominant selling and oversold conditions, yet underlying trend weakness persists, limiting prospects for immediate reversal.
- Price is projected to range between $396.98 and $421.52 over the next 2–3 days, with downside risk predominating unless a breakout above $423.51 occurs.
Oversold signals emerge as bearish momentum outweighs reversal attempts
On the H1 chart, TSLA/USD trades below the MA-20 at $421.51 and MA-50 at $428.27, while the daily time frame places the price under the MA-200 at $413.82. The Ichimoku Kijun sits at $423.51, providing immediate resistance. Intraday action saw a low of $405.90. Momentum indicators show the MACD in a sell setup, the ADX signaling neutral trend strength, and technical oscillators—RSI at 33.9, Stoch RSI, CCI, and BBP—all indicating oversold market conditions and seller dominance. Despite oversold readings on multiple oscillators, negative momentum persists, reflecting a divergence that may imply potential reversal attempts in the short term but does not indicate a definitive trend change.
Downside risk elevated as volatility range caps bullish potential
For the next 2–3 trading days, TSLA is expected to range between $396.98 and $421.52, reflecting a volatility band relative to current levels. The probability of an upward move is described as very low, while a downward move carries a very high probability. The baseline scenario projects sideways movement within this corridor, while a bullish scenario would require a breakout above resistance at $423.51. A bearish scenario could unfold if the price drops below support near $396.98.
Earlier, analysts noted that technical pressure on Tesla shares was mounting amid increased competition for investor capital and potential rotation linked to the SpaceX IPO. The current environment of persistent negative momentum and oversold conditions adds downside risk in the near term, with $396.98 emerging as a key support level for traders to monitor.










-
 Afghanistan
-
 Albania
-
 Algeria
-
 Angola
-
 Argentina
-
 Armenia
-
 Australia
-
 Austria
-
 Azerbaijan
-
 Bahamas
-
 Bahrain
-
 Bangladesh
-
 Belarus
-
 Belgium
-
 Bolivia
-
 Botswana
-
 Brazil
-
 Brunei
-
 Bulgaria
-
 Cambodia
-
 Cameroon
-
 Canada
-
 Chile
Chile
-
 China
China
-
 Colombia
-
 Congo
Congo
-
 Costa Rica
-
 Cote d'Ivoire
-
 Croatia
-
 Cuba
Cuba
-
 Cyprus
-
 Czechia
-
 DR Congo
-
 Denmark
-
 Dominican Republic
-
 Ecuador
-
 Egypt
Egypt
-
 El Salvador
-
 Estonia
-
 Eswatini
-
 Ethiopia
-
 Finland
-
 France
-
 Georgia
-
 Germany
-
 Ghana
Ghana
-
 Greece
-
 Haiti
Haiti
-
 Hong Kong
-
 Hungary
-
 India
India
-
 Indonesia
-
 Iran, Islamic republic
-
 Iraq
Iraq
-
 Ireland
-
 Israel
-
 Italy
Italy
-
 Jamaica
-
 Japan
Japan
-
 Jordan
-
 Kazakhstan
-
 Kenya
Kenya
-
 Korea
Korea
-
 Kuwait
-
 Kyrgyzstan
-
 Laos
Laos
-
 Latvia
-
 Lebanon
-
 Lesotho
-
 Libya
Libya
-
 Lithuania
-
 Luxembourg
-
 Madagascar
-
 Malaysia
-
 Malta
Malta
-
 Mauritius
-
 Mexico
-
 Moldova
-
 Mongolia
-
 Montenegro
-
 Morocco
-
 Mozambique
-
 Myanmar
-
 Namibia
-
 Nepal
Nepal
-
 Netherlands
-
 New Zealand
-
 Nigeria
-
 North Macedonia
-
 Norway
-
 Oman
Oman
-
 Pakistan
-
 Palestine
-
 Panama
-
 Papua New Guinea
-
 Paraguay
-
 Peru
Peru
-
 Philippines
-
 Poland
-
 Portugal
-
 Puerto Rico
-
 Qatar
Qatar
-
 Reunion
-
 Romania
-
 Rwanda
-
 Saudi Arabia
-
 Serbia
-
 Singapore
-
 Slovakia
-
 Slovenia
-
 Somalia
-
 South Africa
-
 Spain
Spain
-
 Sri Lanka
-
 Sweden
-
 Switzerland
-
 Syria
Syria
-
 Taiwan
-
 Tajikistan
-
 Tanzania
-
 Thailand
-
 Trinidad and Tobago
-
 Tunisia
-
 Turkey
-
 UAE
UAE
-
 Uganda
-
 Ukraine
-
 United Kingdom
-
United States
-
 Uruguay
-
 Uzbekistan
-
 Venezuela
-
 Vietnam
-
 Yemen
Yemen
-
 Zambia
-
 Zimbabwe
- Forex
- Crypto











