
Nvidia stock price forecast: $198.40 support in focus as NVDA drops 4.06%

Nvidia Corporation (NVDA) stock is trading at $209.04, marking a daily decline of 4.06%. The current price sits below its key medium-term moving averages, but above longer-term averages.
 211.79
214.39
211.79
214.39
Highlights
- U.S. authorities closed an export control loophole after Chinese firms obtained restricted Nvidia Blackwell chips via overseas subsidiaries, triggering immediate regulatory action.
- Regulatory tightening and new licensing guidance substantially limited Nvidia’s overseas opportunities and increased uncertainty, provoking a sharp sell-off following broad April 2025 tariffs.
- Technicals show NVDA trading below short- and medium-term averages with momentum mixed; price expected to fluctuate between $198.40 and $219.68 over the next several days.
Nvidia pressured as export loophole closure and tariffs limit demand
Officials identified that a loophole in U.S. export controls had enabled Chinese firms to acquire restricted Nvidia Blackwell chips through foreign subsidiaries, resulting in immediate regulatory action to close this channel. The U.S. government subsequently issued further guidance and tightened licensing requirements to prevent circumvention of semiconductor export bans directed at China, which in turn limited Nvidia's access to overseas demand and heightened regulatory uncertainty. In April 2025, sweeping tariffs imposed by the Trump administration led to a pronounced sell-off in Nvidia shares, though a partial pause on tariffs a couple of days later allowed for a limited price recovery.
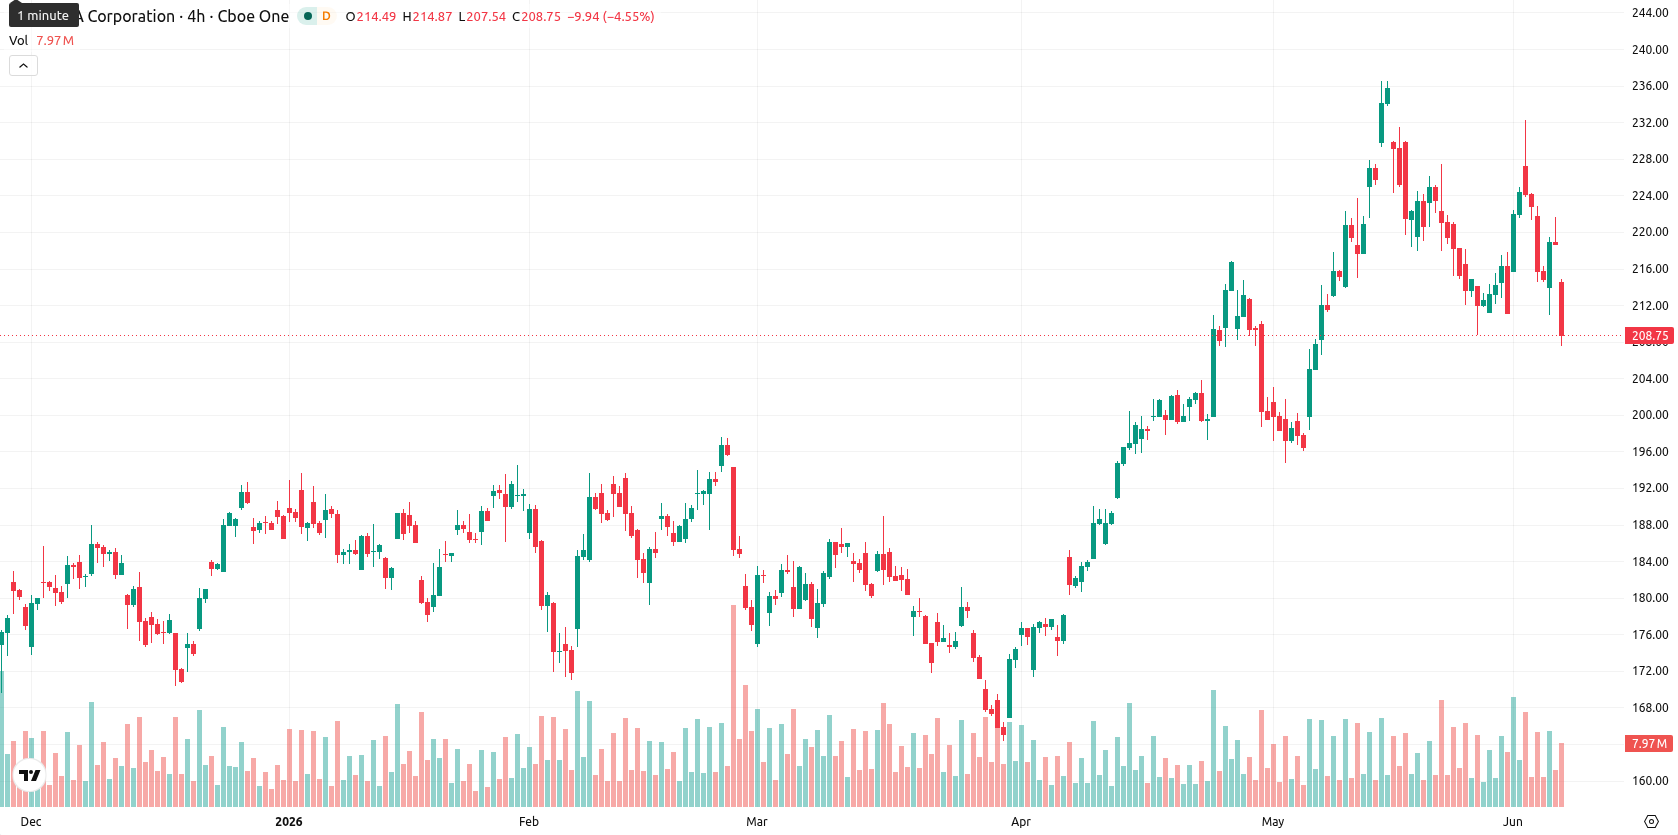
Mixed momentum as MA resistance and indicators send conflicting signals
On the H4 timeframe, NVDA is trading below its MA-20 at $217.20 and MA-50 at $215.83, with the MA-200 providing long-term support near $188.42. The Ichimoku Kijun level stands at $220.53 and functions as immediate resistance, while support is identified around $198.40. Among momentum indicators, the MACD issues a strong buy signal and the RSI suggests buying interest, though Stoch RSI reflects selling pressure and both ADX and CCI remain neutral. Bull/Bear Power (BBP) indicates overbought conditions, and the Awesome Oscillator is neutral, underscoring mixed and uncertain short-term momentum.
Range-bound outlook as short-term breakout risks remain balanced
Over the next two to three trading days, NVDA is expected to move within a typical volatility band of $198.40 to $219.68. Scenario probability estimates suggest a 58% chance of an upward move, while a downward break is somewhat less likely at 42%. A baseline outlook favors range-bound trading between these support and resistance levels. Should price break above $220.53, a bullish scenario could emerge, whereas a move below $198.40 would indicate renewed bearish pressure.
Previously it was reported that Nvidia’s strategic supply chain actions and product initiatives were seen as pivotal, but technical signals suggested continued downside risk amid heightened regulatory scrutiny. New developments around U.S. export controls and mixed momentum indicators now introduce additional uncertainty, making the $220.53 resistance and $198.40 support key levels for traders to monitor as the next directional move takes shape.


Latest NVDA News







-
 Afghanistan
-
 Albania
-
 Algeria
-
 Angola
-
 Argentina
-
 Armenia
-
 Australia
-
 Austria
-
 Azerbaijan
-
 Bahamas
-
 Bahrain
-
 Bangladesh
-
 Belarus
-
 Belgium
-
 Bolivia
-
 Botswana
-
 Brazil
-
 Brunei
-
 Bulgaria
-
 Cambodia
-
 Cameroon
-
 Canada
-
 Chile
Chile
-
 China
China
-
 Colombia
-
 Congo
Congo
-
 Costa Rica
-
 Cote d'Ivoire
-
 Croatia
-
 Cuba
Cuba
-
 Cyprus
-
 Czechia
-
 DR Congo
-
 Denmark
-
 Dominican Republic
-
 Ecuador
-
 Egypt
Egypt
-
 El Salvador
-
 Estonia
-
 Eswatini
-
 Ethiopia
-
 Finland
-
 France
-
 Georgia
-
 Germany
-
 Ghana
Ghana
-
 Greece
-
 Haiti
Haiti
-
 Hong Kong
-
 Hungary
-
 India
India
-
 Indonesia
-
 Iran, Islamic republic
-
 Iraq
Iraq
-
 Ireland
-
 Israel
-
 Italy
Italy
-
 Jamaica
-
 Japan
Japan
-
 Jordan
-
 Kazakhstan
-
 Kenya
Kenya
-
 Korea
Korea
-
 Kuwait
-
 Kyrgyzstan
-
 Laos
Laos
-
 Latvia
-
 Lebanon
-
 Lesotho
-
 Libya
Libya
-
 Lithuania
-
 Luxembourg
-
 Madagascar
-
 Malaysia
-
 Malta
Malta
-
 Mauritius
-
 Mexico
-
 Moldova
-
 Mongolia
-
 Montenegro
-
 Morocco
-
 Mozambique
-
 Myanmar
-
 Namibia
-
 Nepal
Nepal
-
 Netherlands
-
 New Zealand
-
 Nigeria
-
 North Macedonia
-
 Norway
-
 Oman
Oman
-
 Pakistan
-
 Palestine
-
 Panama
-
 Papua New Guinea
-
 Paraguay
-
 Peru
Peru
-
 Philippines
-
 Poland
-
 Portugal
-
 Puerto Rico
-
 Qatar
Qatar
-
 Reunion
-
 Romania
-
 Rwanda
-
 Saudi Arabia
-
 Serbia
-
 Singapore
-
 Slovakia
-
 Slovenia
-
 Somalia
-
 South Africa
-
 Spain
Spain
-
 Sri Lanka
-
 Sweden
-
 Switzerland
-
 Syria
Syria
-
 Taiwan
-
 Tajikistan
-
 Tanzania
-
 Thailand
-
 Trinidad and Tobago
-
 Tunisia
-
 Turkey
-
 UAE
UAE
-
 Uganda
-
 Ukraine
-
 United Kingdom
-
United States
-
 Uruguay
-
 Uzbekistan
-
 Venezuela
-
 Vietnam
-
 Yemen
Yemen
-
 Zambia
-
 Zimbabwe
- Forex
- Crypto












