
Micron Technology stock price forecast: Testing $787.64 support as MU drops nearly 11%

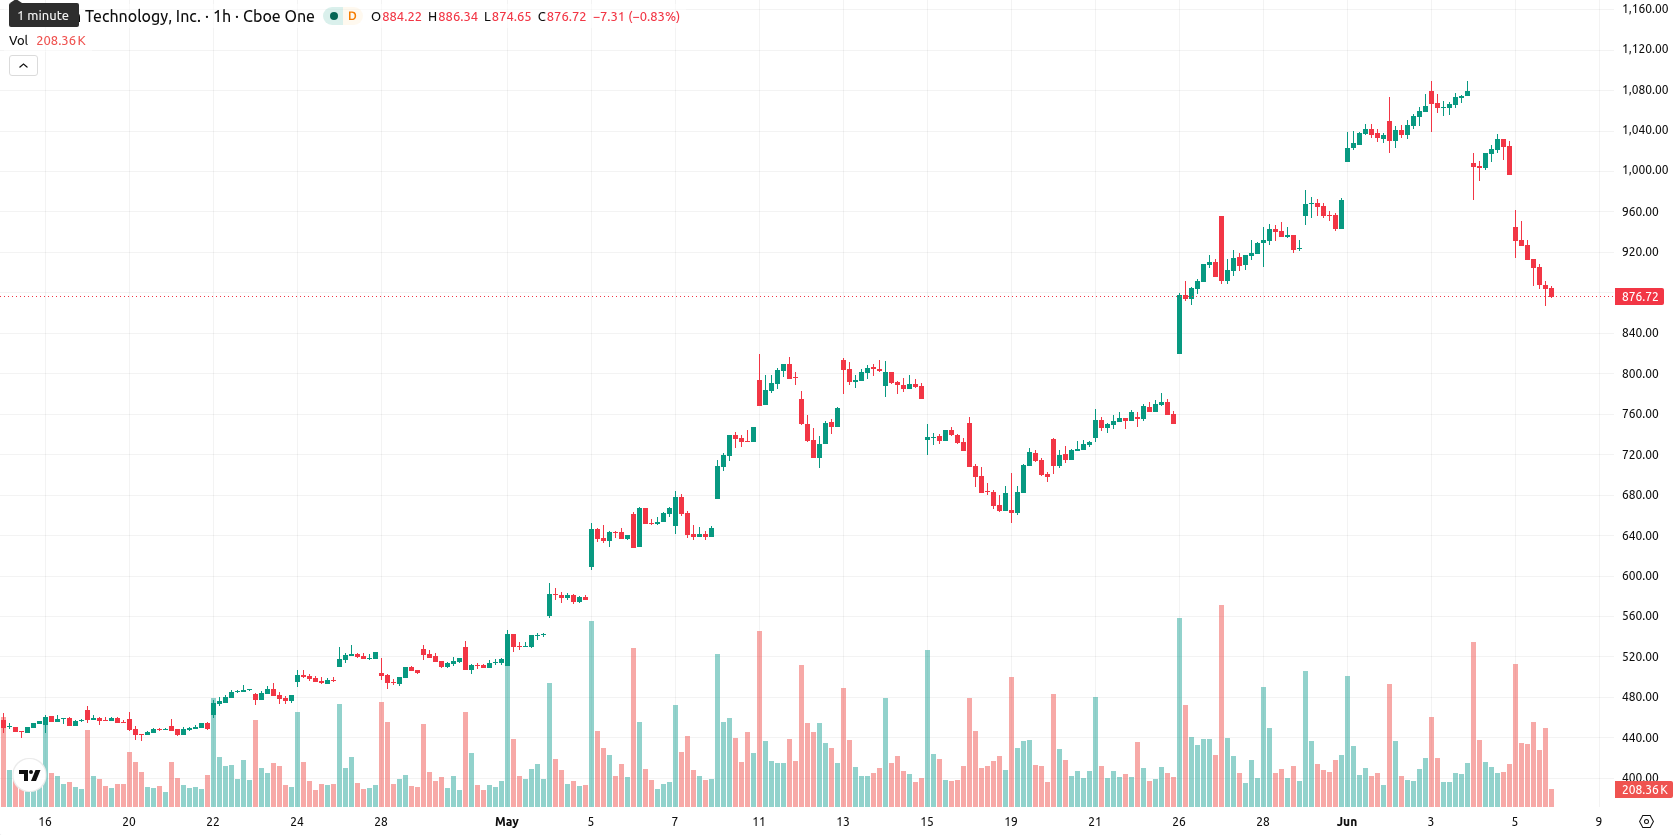
Micron Technology (MU) stock is trading at $881.92, marking a sharp daily decline of 10.95%. The price sits below its key moving averages in the short and medium term, reflecting continued downward momentum in the near term.
 997.70
1035.50
997.70
1035.50
Highlights
- Micron posted $23.9 billion in quarterly revenue, surging 75% quarter-over-quarter, fueled by robust high-bandwidth memory demand.
- Long-term order books for high-bandwidth memory are secured through 2027, with Nvidia selecting Micron as a key supplier in AI.
- MU/USD faces persistent bearish momentum and heavy selling, with price likely to consolidate between $787.64 and $934.19 over the next few days.
Long-term demand optimism offset by near-term selling pressure
Micron reported quarterly revenue of $23.9 billion, a 75% increase from the prior quarter and a 196% rise year-over-year, which highlights a surge in demand for high-bandwidth memory products according to TipRanks. Management further indicated that orders for these products are largely booked through 2027, reflecting strong long-term contracted demand. Micron was also selected by Nvidia to supply high-bandwidth memory, expanding its partnerships in the AI segment. These operational milestones have been accompanied by persistent concerns about broader memory-chip demand, as reported by moomoo.com and TipRanks, though price action has remained under broader selling pressure.
Bearish momentum confirmed as key support levels broken
On the technical front, MU/USD has broken below both its MA-20 ($997.30) and MA-50 ($995.36) on the hourly chart, while staying well above the long-term MA-200 on the daily timeframe at $357.07. Immediate resistance is defined by the Ichimoku Kijun level at $979.99. Momentum indicators confirm a bearish setup: the MACD and ADX both signal a strong sell environment, while the RSI stands at 20.23 and, along with Stoch RSI and CCI, indicates oversold conditions. The Bull/Bear Power (BBP) is negative, affirming intraday seller dominance, and the Awesome Oscillator supports the prevailing downtrend.
Downside risk prevails as volatility range tightens
In the short term, the expected trading range over the next 2 to 3 sessions is projected between $787.64 and $934.19, reflecting a volatility band relative to current levels. The probability of further downside is estimated at 71%, while chances for a rebound are limited to 29%, suggesting additional weakness remains likely. A baseline scenario anticipates consolidation within this range. A sustained move higher would require a break above the $979.99 resistance, while a drop below $787.64 would trigger a bearish extension.
In a recent review, analysts noted that despite significant short-term volatility, Micron Technology maintained a broadly bullish long-term outlook supported by its strategic position in AI memory markets. With the current breakdown below short- and medium-term averages and persistent bearish momentum, traders should monitor for a decisive move outside the projected $787.64–$934.19 range as a signal for the next major trend.


Latest Micron Technology News







-
 Afghanistan
-
 Albania
-
 Algeria
-
 Angola
-
 Argentina
-
 Armenia
-
 Australia
-
 Austria
-
 Azerbaijan
-
 Bahamas
-
 Bahrain
-
 Bangladesh
-
 Belarus
-
 Belgium
-
 Bolivia
-
 Botswana
-
 Brazil
-
 Brunei
-
 Bulgaria
-
 Cambodia
-
 Cameroon
-
 Canada
-
 Chile
Chile
-
 China
China
-
 Colombia
-
 Congo
Congo
-
 Costa Rica
-
 Cote d'Ivoire
-
 Croatia
-
 Cuba
Cuba
-
 Cyprus
-
 Czechia
-
 DR Congo
-
 Denmark
-
 Dominican Republic
-
 Ecuador
-
 Egypt
Egypt
-
 El Salvador
-
 Estonia
-
 Eswatini
-
 Ethiopia
-
 Finland
-
 France
-
 Georgia
-
 Germany
-
 Ghana
Ghana
-
 Greece
-
 Haiti
Haiti
-
 Hong Kong
-
 Hungary
-
 India
India
-
 Indonesia
-
 Iran, Islamic republic
-
 Iraq
Iraq
-
 Ireland
-
 Israel
-
 Italy
Italy
-
 Jamaica
-
 Japan
Japan
-
 Jordan
-
 Kazakhstan
-
 Kenya
Kenya
-
 Korea
Korea
-
 Kuwait
-
 Kyrgyzstan
-
 Laos
Laos
-
 Latvia
-
 Lebanon
-
 Lesotho
-
 Libya
Libya
-
 Lithuania
-
 Luxembourg
-
 Madagascar
-
 Malaysia
-
 Malta
Malta
-
 Mauritius
-
 Mexico
-
 Moldova
-
 Mongolia
-
 Montenegro
-
 Morocco
-
 Mozambique
-
 Myanmar
-
 Namibia
-
 Nepal
Nepal
-
 Netherlands
-
 New Zealand
-
 Nigeria
-
 North Macedonia
-
 Norway
-
 Oman
Oman
-
 Pakistan
-
 Palestine
-
 Panama
-
 Papua New Guinea
-
 Paraguay
-
 Peru
Peru
-
 Philippines
-
 Poland
-
 Portugal
-
 Puerto Rico
-
 Qatar
Qatar
-
 Reunion
-
 Romania
-
 Rwanda
-
 Saudi Arabia
-
 Serbia
-
 Singapore
-
 Slovakia
-
 Slovenia
-
 Somalia
-
 South Africa
-
 Spain
Spain
-
 Sri Lanka
-
 Sweden
-
 Switzerland
-
 Syria
Syria
-
 Taiwan
-
 Tajikistan
-
 Tanzania
-
 Thailand
-
 Trinidad and Tobago
-
 Tunisia
-
 Turkey
-
 UAE
UAE
-
 Uganda
-
 Ukraine
-
 United Kingdom
-
United States
-
 Uruguay
-
 Uzbekistan
-
 Venezuela
-
 Vietnam
-
 Yemen
Yemen
-
 Zambia
-
 Zimbabwe
- Forex
- Crypto











