
Affirm stock gains 3.18% as WINTON GROUP stake purchase in Q4 boosts sentiment

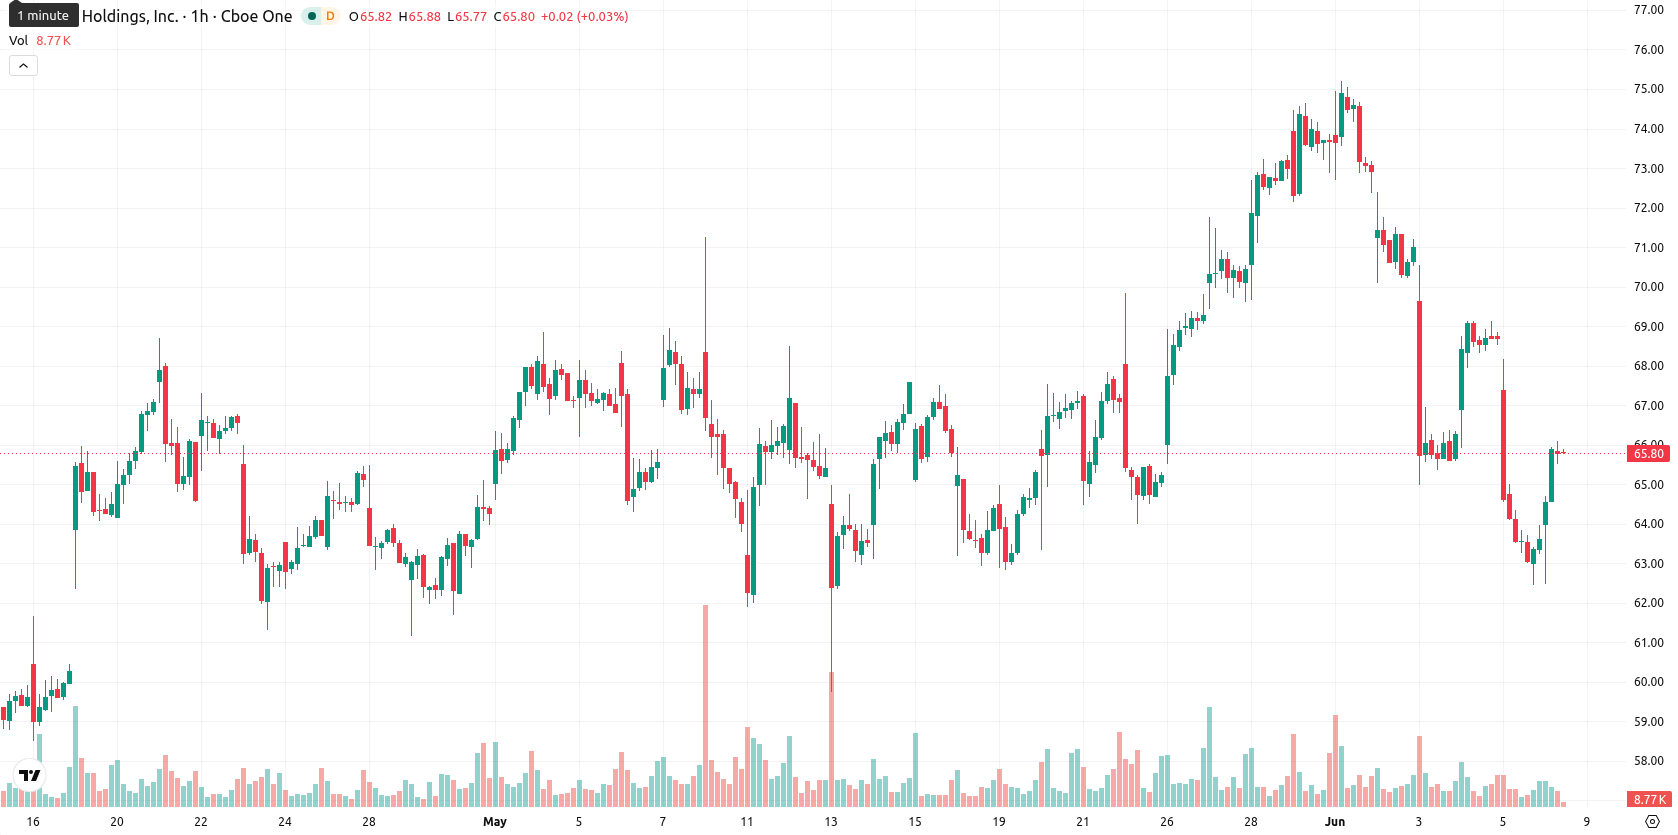
Affirm Holdings, Inc. (AFRM) stock is trading at $65.63 after rising 3.18% on the day. The price remains situated beneath its key moving averages, with recent trading reflecting ongoing selling pressure across multiple timeframes.
 85.80
86.77
85.80
86.77
Highlights
- Winton Group's $6.13 million investment in Affirm adds significant institutional support during the fourth quarter.
- Affirm's adjusted EPS of $0.30 surpassed expectations, but quarterly revenue of $943.95 million missed analyst estimates, reflecting slower top-line growth.
- Affirm trades below key moving averages, with momentum and trend indicators skewing bearish and price likely consolidating between $61.20 and $70.06 near term.
Institional inflows and mixed earnings sentiment as profitability beats but revenue lags
WINTON GROUP Ltd has acquired a new stake in Affirm Holdings, Inc., purchasing 82,304 shares valued at approximately $6.13 million during the fourth quarter, which brings notable institutional capital to the company and may stimulate additional buying interest. Affirm’s latest quarterly earnings showed earnings per share of $0.30, significantly exceeding consensus expectations and highlighting improved profitability on an operational basis. While the company achieved a return on equity of 11.17% and maintained a net margin of 9.63%, quarterly revenue reached $943.95 million, coming in below analyst estimates and signaling a degree of caution around top-line expansion.
Mixed momentum signals as price struggles with resistance zones
On the hourly chart, AFRM trades below the MA-20 level of $66.04 and MA-50 at $69.54, as well as below the long-term MA-200 at $67.15. The Ichimoku Kijun sits at $66.83 and marks the next immediate resistance zone. Momentum indicators present a weak outlook: MACD and ADX both signal a sell bias. RSI registers 45.3, which is interpreted as a sell reading, while the Stoch RSI is currently in the overbought region. The CCI prints a neutral stance, and BBP suggests a slight advantage for buyers during intraday sessions. Overall, technical signals remain mixed, with oscillators warning of momentum exhaustion despite a recent strong price move.
Downside risk prevails as range-bound consolidation expected
AFRM is likely to trade between $61.20 and $70.06 over the next few days, representing a typical volatility band relative to current levels. The probability of a downward move is higher, estimated at 65%, while upward movement has a 35% likelihood. The base expectation is for continued consolidation within this defined range, with a bullish scenario requiring a sustained breakout above $66.83 resistance and a bearish outcome unfolding if price falls below $61.20 support.
Earlier, analysts noted that Affirm's outlook was supported by institutional accumulation and earnings strength, while short-term technicals remained mixed. The latest assessment adds that despite new institutional buying and operational profitability, continued volatility suggests traders should monitor for a decisive move above $66.83 resistance or below $61.20 support as key signals for the next directional trend.


Latest Affirm News






-
 Afghanistan
-
 Albania
-
 Algeria
-
 Angola
-
 Argentina
-
 Armenia
-
 Australia
-
 Austria
-
 Azerbaijan
-
 Bahamas
-
 Bahrain
-
 Bangladesh
-
 Belarus
-
 Belgium
-
 Bolivia
-
 Botswana
-
 Brazil
-
 Brunei
-
 Bulgaria
-
 Cambodia
-
 Cameroon
-
 Canada
-
 Chile
Chile
-
 China
China
-
 Colombia
-
 Congo
Congo
-
 Costa Rica
-
 Cote d'Ivoire
-
 Croatia
-
 Cuba
Cuba
-
 Cyprus
-
 Czechia
-
 DR Congo
-
 Denmark
-
 Dominican Republic
-
 Ecuador
-
 Egypt
Egypt
-
 El Salvador
-
 Estonia
-
 Eswatini
-
 Ethiopia
-
 Finland
-
 France
-
 Georgia
-
 Germany
-
 Ghana
Ghana
-
 Greece
-
 Haiti
Haiti
-
 Hong Kong
-
 Hungary
-
 India
India
-
 Indonesia
-
 Iran, Islamic republic
-
 Iraq
Iraq
-
 Ireland
-
 Israel
-
 Italy
Italy
-
 Jamaica
-
 Japan
Japan
-
 Jordan
-
 Kazakhstan
-
 Kenya
Kenya
-
 Korea
Korea
-
 Kuwait
-
 Kyrgyzstan
-
 Laos
Laos
-
 Latvia
-
 Lebanon
-
 Lesotho
-
 Libya
Libya
-
 Lithuania
-
 Luxembourg
-
 Madagascar
-
 Malaysia
-
 Malta
Malta
-
 Mauritius
-
 Mexico
-
 Moldova
-
 Mongolia
-
 Montenegro
-
 Morocco
-
 Mozambique
-
 Myanmar
-
 Namibia
-
 Nepal
Nepal
-
 Netherlands
-
 New Zealand
-
 Nigeria
-
 North Macedonia
-
 Norway
-
 Oman
Oman
-
 Pakistan
-
 Palestine
-
 Panama
-
 Papua New Guinea
-
 Paraguay
-
 Peru
Peru
-
 Philippines
-
 Poland
-
 Portugal
-
 Puerto Rico
-
 Qatar
Qatar
-
 Reunion
-
 Romania
-
 Rwanda
-
 Saudi Arabia
-
 Serbia
-
 Singapore
-
 Slovakia
-
 Slovenia
-
 Somalia
-
 South Africa
-
 Spain
Spain
-
 Sri Lanka
-
 Sweden
-
 Switzerland
-
 Syria
Syria
-
 Taiwan
-
 Tajikistan
-
 Tanzania
-
 Thailand
-
 Trinidad and Tobago
-
 Tunisia
-
 Turkey
-
 UAE
UAE
-
 Uganda
-
 Ukraine
-
 United Kingdom
-
United States
-
 Uruguay
-
 Uzbekistan
-
 Venezuela
-
 Vietnam
-
 Yemen
Yemen
-
 Zambia
-
 Zimbabwe
- Forex
- Crypto











