
Regeneron Pharmaceuticals stock price forecast: $588.98 support in focus as REGN slides 3.86%

Regeneron Pharmaceuticals (REGN) stock is trading at $611.01 after losing 3.86% on the day, underperforming across key moving averages on a pronounced sell-off and closing near session lows.
 663.33
677.92
663.33
677.92
Highlights
- EYLEA HD sales surged 52% in Q1 2026, countering internal competition and supporting Regeneron's portfolio growth.
- DUPIXENT performance and new FDA approvals for EYLEA HD and CEMDISIRAN diversify revenues and give near-term regulatory clarity.
- REGN trades below major moving averages with momentum skewed bearish, and price is likely to fluctuate between $588.98 and $633.04; further downside risk is elevated.
Portfolio strength offsets internal pressures as institutional holders persist
U.S. sales of EYLEA HD surged 52% in the first quarter of 2026, signaling increased demand within Regeneron's core portfolio and helping mitigate the effects of internal product competition and patient switching, according to official reports. The period also saw robust growth from DUPIXENT, which has broadened the company's revenue stream and balanced exposure across flagship assets. Recent FDA approvals for EYLEA HD and CEMDISIRAN have provided additional regulatory certainty and near-term product catalysts, as noted by Seeking Alpha, while institutional investors and hedge funds retained a significant 83.31% ownership in the stock, per American Market News — though price action has remained under broader selling pressure.
Mixed momentum persists as shares breach key support levels
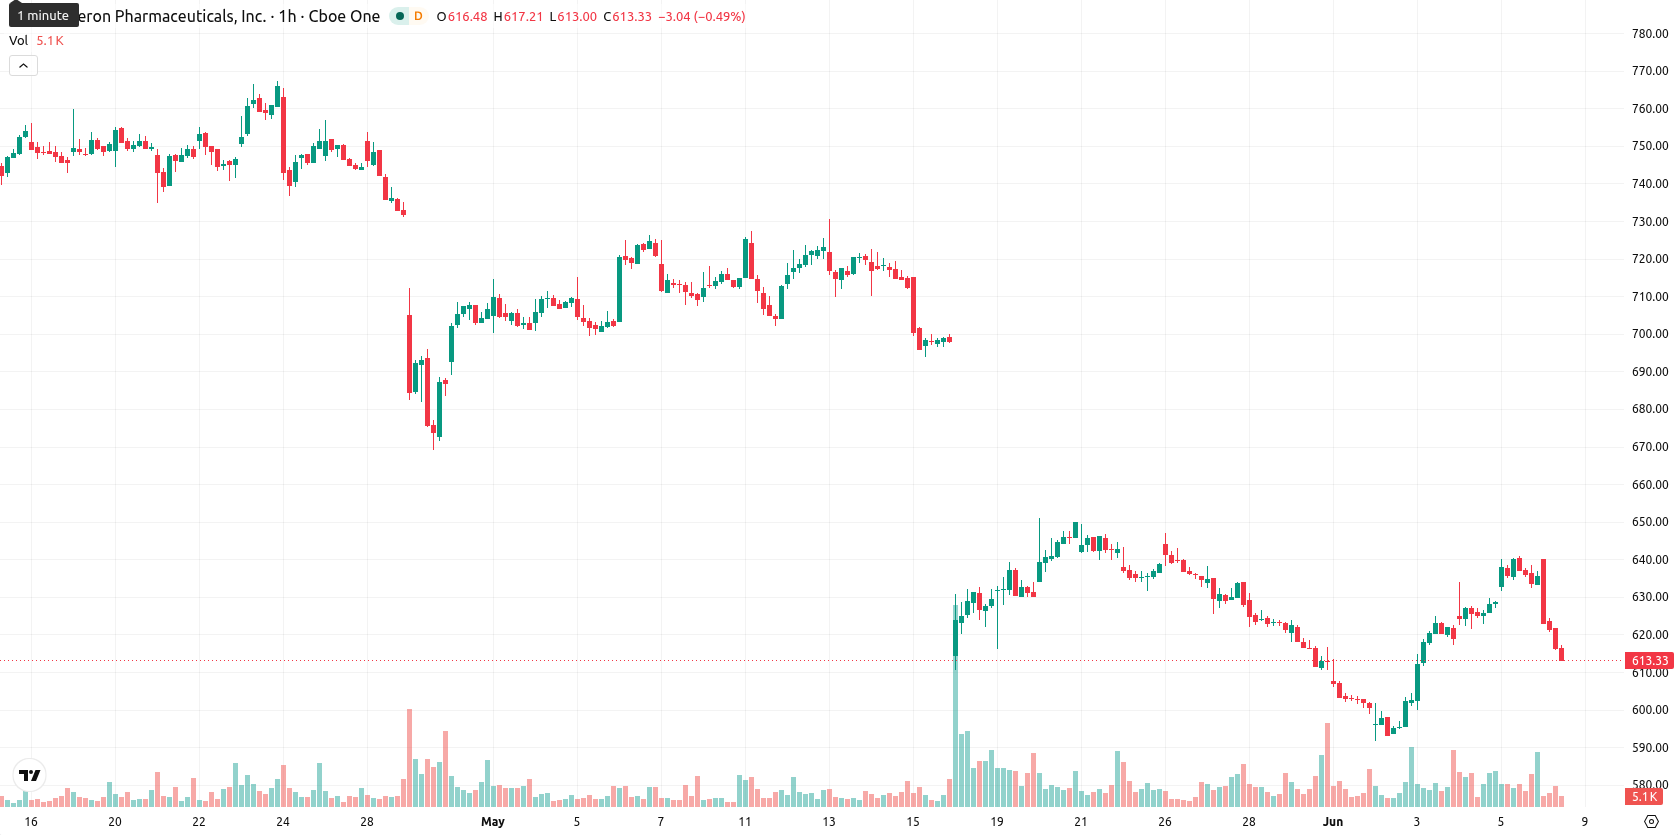
Specific technical levels indicate that REGN closed below its MA-20 at $628.03, MA-50 at $617.29, and well under MA-200 at $695.88. The immediate resistance stands at the Ichimoku Kijun level of $619.91. Momentum indicators present a mixed view: MACD signals a strong buy, while ADX points to selling conditions. The RSI at 39.95, together with oversold readings from Stoch RSI and CCI, underscores seller dominance. BBP is firmly in oversold territory, lending support to continued selling pressure. The Awesome Oscillator remains neutral after substantial high-volatility activity and a close near the day's low.
Downside risk prevails as trading range narrows amid volatility
Over the coming sessions, REGN is likely to trade within a typical volatility band stretching from $588.98 to $633.04. There is a 70% probability of continued downside movement and a 30% chance of a near-term reversal. The base-case scenario sees price action confined to this corridor, with a breakout above $619.91 resistance possibly signaling a bullish reversal, while a drop below $588.98 could accelerate further declines.
Earlier, analysts noted that Regeneron faced deepening downside momentum and heightened risk amid sustained technical weakness. The current combination of persistent selling pressure and mixed momentum signals suggests traders should monitor for a decisive move outside the $588.98 to $633.04 volatility band, as a breakout may set the stage for a directional shift.



Latest Regeneron Pharmaceuticals News







-
 Afghanistan
-
 Albania
-
 Algeria
-
 Angola
-
 Argentina
-
 Armenia
-
 Australia
-
 Austria
-
 Azerbaijan
-
 Bahamas
-
 Bahrain
-
 Bangladesh
-
 Belarus
-
 Belgium
-
 Bolivia
-
 Botswana
-
 Brazil
-
 Brunei
-
 Bulgaria
-
 Cambodia
-
 Cameroon
-
 Canada
-
 Chile
Chile
-
 China
China
-
 Colombia
-
 Congo
Congo
-
 Costa Rica
-
 Cote d'Ivoire
-
 Croatia
-
 Cuba
Cuba
-
 Cyprus
-
 Czechia
-
 DR Congo
-
 Denmark
-
 Dominican Republic
-
 Ecuador
-
 Egypt
Egypt
-
 El Salvador
-
 Estonia
-
 Eswatini
-
 Ethiopia
-
 Finland
-
 France
-
 Georgia
-
 Germany
-
 Ghana
Ghana
-
 Greece
-
 Haiti
Haiti
-
 Hong Kong
-
 Hungary
-
 India
India
-
 Indonesia
-
 Iran, Islamic republic
-
 Iraq
Iraq
-
 Ireland
-
 Israel
-
 Italy
Italy
-
 Jamaica
-
 Japan
Japan
-
 Jordan
-
 Kazakhstan
-
 Kenya
Kenya
-
 Korea
Korea
-
 Kuwait
-
 Kyrgyzstan
-
 Laos
Laos
-
 Latvia
-
 Lebanon
-
 Lesotho
-
 Libya
Libya
-
 Lithuania
-
 Luxembourg
-
 Madagascar
-
 Malaysia
-
 Malta
Malta
-
 Mauritius
-
 Mexico
-
 Moldova
-
 Mongolia
-
 Montenegro
-
 Morocco
-
 Mozambique
-
 Myanmar
-
 Namibia
-
 Nepal
Nepal
-
 Netherlands
-
 New Zealand
-
 Nigeria
-
 North Macedonia
-
 Norway
-
 Oman
Oman
-
 Pakistan
-
 Palestine
-
 Panama
-
 Papua New Guinea
-
 Paraguay
-
 Peru
Peru
-
 Philippines
-
 Poland
-
 Portugal
-
 Puerto Rico
-
 Qatar
Qatar
-
 Reunion
-
 Romania
-
 Rwanda
-
 Saudi Arabia
-
 Serbia
-
 Singapore
-
 Slovakia
-
 Slovenia
-
 Somalia
-
 South Africa
-
 Spain
Spain
-
 Sri Lanka
-
 Sweden
-
 Switzerland
-
 Syria
Syria
-
 Taiwan
-
 Tajikistan
-
 Tanzania
-
 Thailand
-
 Trinidad and Tobago
-
 Tunisia
-
 Turkey
-
 UAE
UAE
-
 Uganda
-
 Ukraine
-
 United Kingdom
-
United States
-
 Uruguay
-
 Uzbekistan
-
 Venezuela
-
 Vietnam
-
 Yemen
Yemen
-
 Zambia
-
 Zimbabwe
- Forex
- Crypto











