
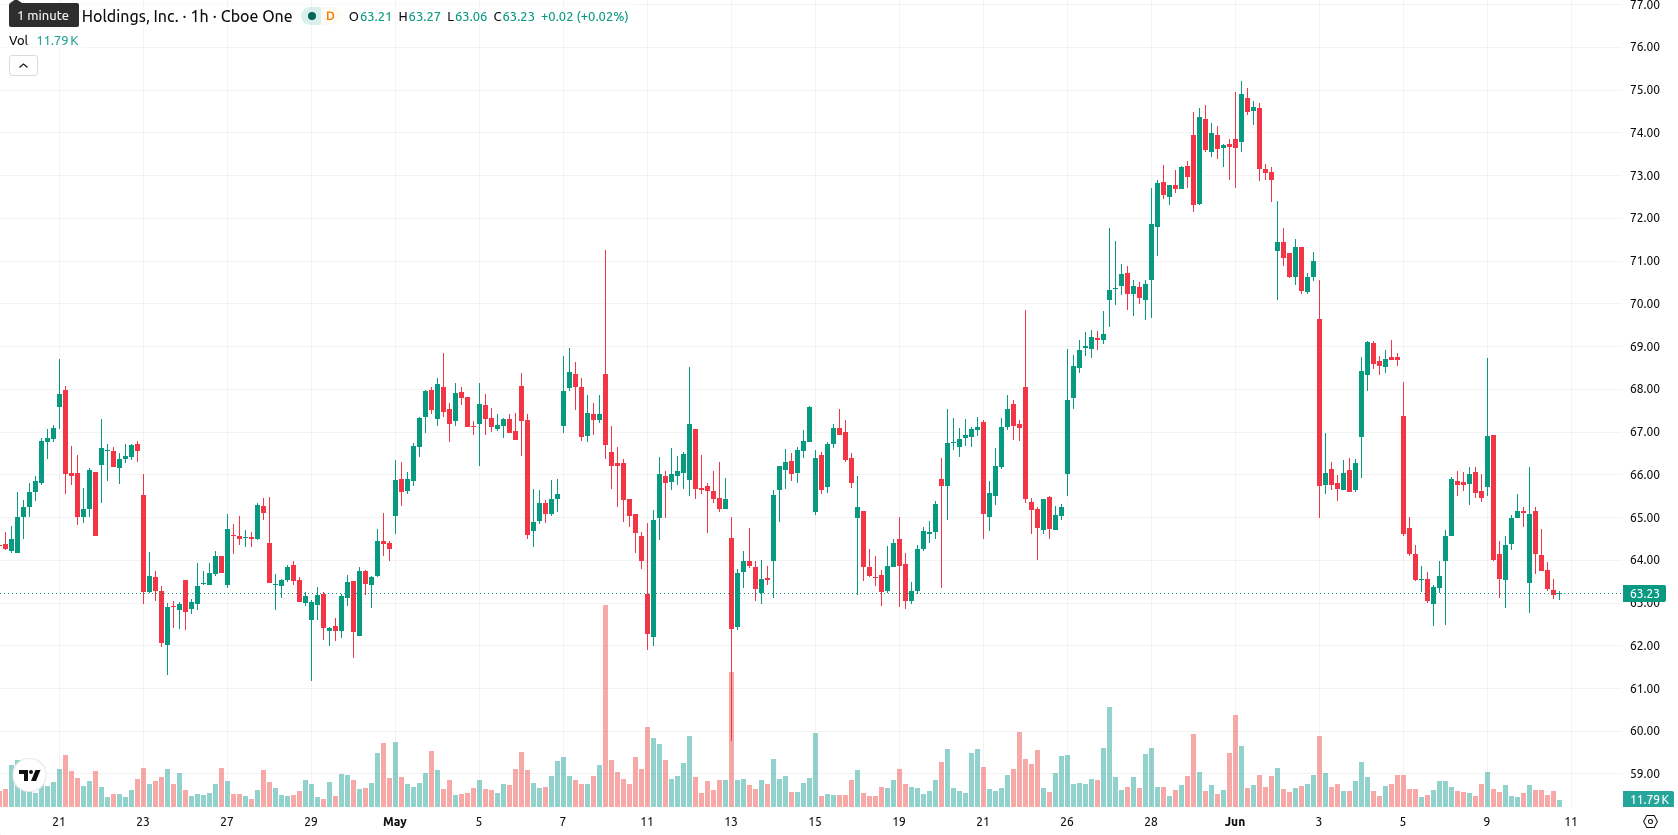
Affirm stock price forecast: Testing $60.16 support as AFRM falls 3.02% to $63.14

Affirm Holdings, Inc. (AFRM) stock is trading at $63.14, down 3.02% on the day. The chart shows the price positioned below its key moving averages, reflecting sustained downward momentum amid high volatility.
Highlights
- AFRM/USD trades below key moving averages, indicating sustained bearish momentum across all timeframes.
- Momentum and breadth indicators confirm strong seller control, with oversold readings and negative trading bias intraday.
- Price action targets a range of $60.16 to $66.12, with a high probability of further declines and resistance near $65.59.
Seller control strengthens with oversold readings and resistance overhead
On the H1 timeframe, AFRM/USD is trading below the MA-20 ($64.77), MA-50 ($66.51), and long-term MA-200 ($67.07). The Ichimoku Kijun is at $65.59, highlighting immediate resistance. Momentum indicators, including MACD and ADX, register Sell signals, with an RSI of 37.07 and both Stoch RSI, CCI, and BBP in oversold territory. Seller dominance is reinforced by negative readings from the Awesome Oscillator.
Range-bound movement expected as downside risks dominate
Over the next several sessions, a typical volatility range is expected between $60.16 and $66.12. The probability of further downside remains very high, while upward movement appears unlikely. The baseline scenario is for sideways price action within this band, with a potential bullish breakout requiring a sustained move above immediate resistance, and a bearish scenario confirmed by a decisive drop below support.
Earlier, analysts noted that Affirm was navigating a period of mixed technical signals with heightened volatility and an uncertain near-term direction. Recent price action under intensifying bearish momentum reinforces downside risks, making it critical for traders to monitor for a sustained break below the current volatility band as confirmation of further weakness.


Latest Affirm News


-
 Afghanistan
-
 Albania
-
 Algeria
-
 Angola
-
 Argentina
-
 Armenia
-
 Australia
-
 Austria
-
 Azerbaijan
-
 Bahamas
-
 Bahrain
-
 Bangladesh
-
 Belarus
-
 Belgium
-
 Bolivia
-
 Botswana
-
 Brazil
-
 Brunei
-
 Bulgaria
-
 Cambodia
-
 Cameroon
-
 Canada
-
 Chile
Chile
-
 China
China
-
 Colombia
-
 Congo
Congo
-
 Costa Rica
-
 Cote d'Ivoire
-
 Croatia
-
 Cuba
Cuba
-
 Cyprus
-
 Czechia
-
 DR Congo
-
 Denmark
-
 Dominican Republic
-
 Ecuador
-
 Egypt
Egypt
-
 El Salvador
-
 Estonia
-
 Eswatini
-
 Ethiopia
-
 Finland
-
 France
-
 Georgia
-
 Germany
-
 Ghana
Ghana
-
 Greece
-
 Haiti
Haiti
-
 Hong Kong
-
 Hungary
-
 India
India
-
 Indonesia
-
 Iran, Islamic republic
-
 Iraq
Iraq
-
 Ireland
-
 Israel
-
 Italy
Italy
-
 Jamaica
-
 Japan
Japan
-
 Jordan
-
 Kazakhstan
-
 Kenya
Kenya
-
 Korea
Korea
-
 Kuwait
-
 Kyrgyzstan
-
 Laos
Laos
-
 Latvia
-
 Lebanon
-
 Lesotho
-
 Libya
Libya
-
 Lithuania
-
 Luxembourg
-
 Madagascar
-
 Malaysia
-
 Malta
Malta
-
 Mauritius
-
 Mexico
-
 Moldova
-
 Mongolia
-
 Montenegro
-
 Morocco
-
 Mozambique
-
 Myanmar
-
 Namibia
-
 Nepal
Nepal
-
 Netherlands
-
 New Zealand
-
 Nigeria
-
 North Macedonia
-
 Norway
-
 Oman
Oman
-
 Pakistan
-
 Palestine
-
 Panama
-
 Papua New Guinea
-
 Paraguay
-
 Peru
Peru
-
 Philippines
-
 Poland
-
 Portugal
-
 Puerto Rico
-
 Qatar
Qatar
-
 Reunion
-
 Romania
-
 Rwanda
-
 Saudi Arabia
-
 Serbia
-
 Singapore
-
 Slovakia
-
 Slovenia
-
 Somalia
-
 South Africa
-
 Spain
Spain
-
 Sri Lanka
-
 Sweden
-
 Switzerland
-
 Syria
Syria
-
 Taiwan
-
 Tajikistan
-
 Tanzania
-
 Thailand
-
 Trinidad and Tobago
-
 Tunisia
-
 Turkey
-
 UAE
UAE
-
 Uganda
-
 Ukraine
-
 United Kingdom
-
United States
-
 Uruguay
-
 Uzbekistan
-
 Venezuela
-
 Vietnam
-
 Yemen
Yemen
-
 Zambia
-
 Zimbabwe
- Forex
- Crypto
