
Sundial Growers stock trades down as price remains well below long-term levels

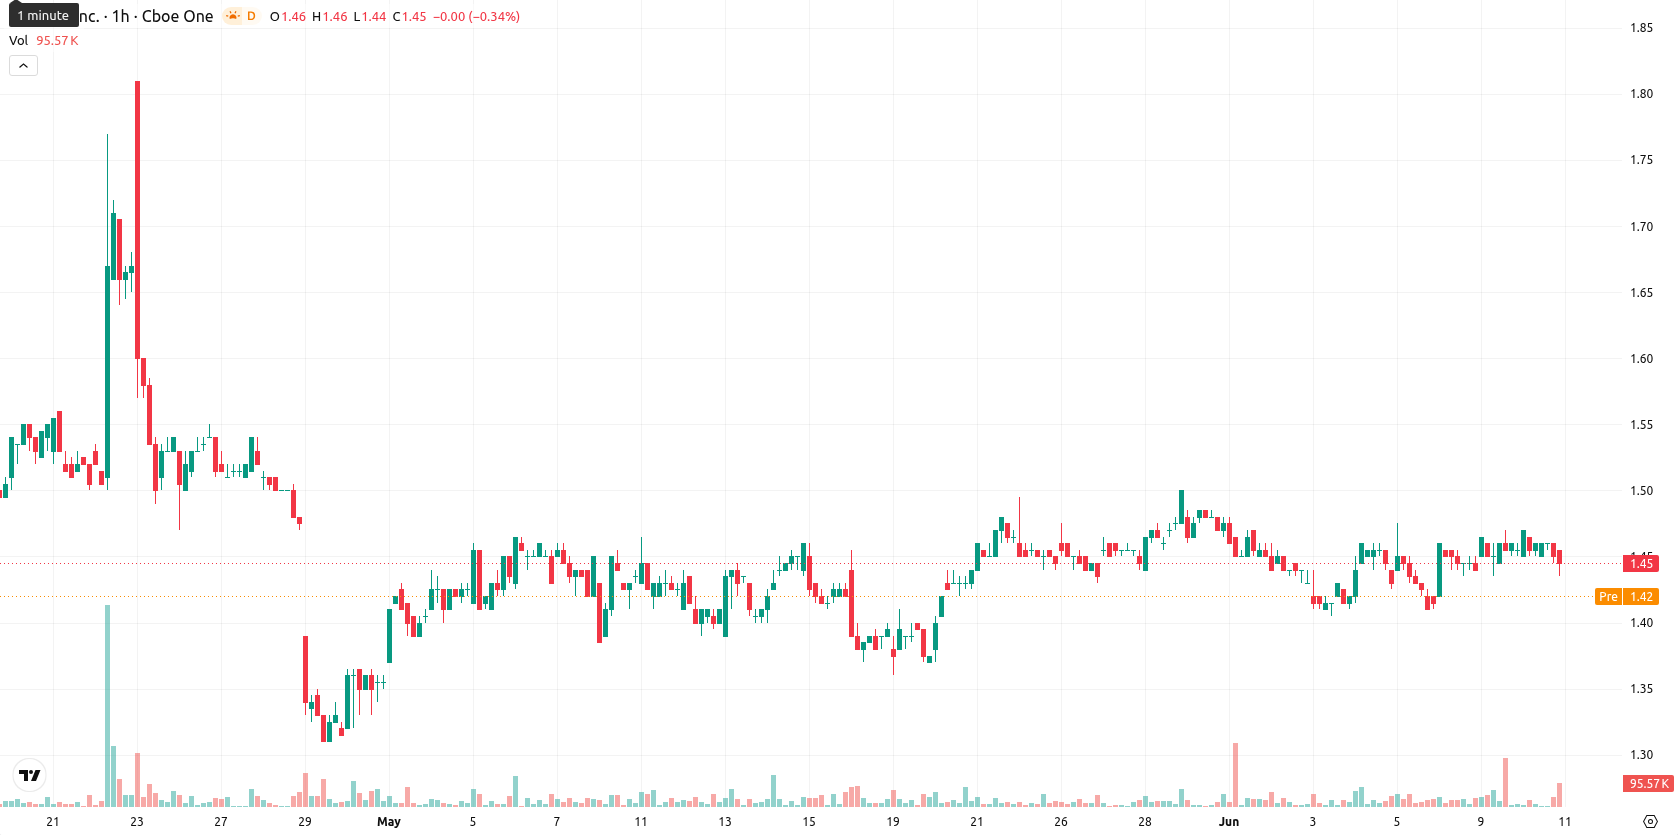
Sundial Growers Inc. (SNDL) stock is trading at $1.44 after a daily decline of 1.37%. The price sits below its key moving averages overall but is maintaining a position just above medium-term levels.
Highlights
- SNDL trades with short-term bearish momentum and remains below major moving averages, signaling prevailing seller pressure.
- Oscillators indicate oversold conditions and momentum signals are mixed, creating uncertainty around trend strength and direction.
- Price is expected to fluctuate between $1.40 and $1.48, with a 76% probability of further downside if $1.40 support fails.
Mixed momentum signals as oversold exhaustion meets MACD strength
On the H1 timeframe, SNDL is trading below the MA-20 and MA-200, while remaining just above the MA-50. The Ichimoku Kijun level at $1.44 serves as immediate support. Momentum signals are mixed: the MACD indicates a strong buy, ADX is neutral, and RSI signals a sell bias. Both the Stoch RSI and CCI are in oversold territory, suggesting short-term exhaustion from sellers. Bull/Bear Power (BBP) confirms intraday seller dominance, and the Awesome Oscillator is neutral, providing no confirmation of the downtrend. Daily losses and oversold oscillators diverge from the MACD's upside signal, highlighting conflicting momentum signals.
Sideways trading likely as downside risk outweighs rebound odds
For the next few days, the price is expected to fluctuate within the $1.40 to $1.48 range, reflecting typical volatility for SNDL at current levels. The probability of further downside stands at 76%, compared to a 24% chance of a reversal to the upside, making a rebound less likely. The baseline scenario anticipates continued sideways trading between these boundaries. A bullish case would require SNDL to reclaim and sustain levels above $1.48, while failure of support at $1.40 could trigger deeper declines.
Earlier, analysts noted that Sundial Growers exhibited mixed momentum signals amid expectations for sideways trading with a cautiously bullish tilt. The current environment adds a more pronounced downside risk, highlighting $1.40 as a pivotal support level that traders should monitor closely for any potential shift in trend.


-
 Afghanistan
-
 Albania
-
 Algeria
-
 Angola
-
 Argentina
-
 Armenia
-
 Australia
-
 Austria
-
 Azerbaijan
-
 Bahamas
-
 Bahrain
-
 Bangladesh
-
 Belarus
-
 Belgium
-
 Bolivia
-
 Botswana
-
 Brazil
-
 Brunei
-
 Bulgaria
-
 Cambodia
-
 Cameroon
-
 Canada
-
 Chile
Chile
-
 China
China
-
 Colombia
-
 Congo
Congo
-
 Costa Rica
-
 Cote d'Ivoire
-
 Croatia
-
 Cuba
Cuba
-
 Cyprus
-
 Czechia
-
 DR Congo
-
 Denmark
-
 Dominican Republic
-
 Ecuador
-
 Egypt
Egypt
-
 El Salvador
-
 Estonia
-
 Eswatini
-
 Ethiopia
-
 Finland
-
 France
-
 Georgia
-
 Germany
-
 Ghana
Ghana
-
 Greece
-
 Haiti
Haiti
-
 Hong Kong
-
 Hungary
-
 India
India
-
 Indonesia
-
 Iran, Islamic republic
-
 Iraq
Iraq
-
 Ireland
-
 Israel
-
 Italy
Italy
-
 Jamaica
-
 Japan
Japan
-
 Jordan
-
 Kazakhstan
-
 Kenya
Kenya
-
 Korea
Korea
-
 Kuwait
-
 Kyrgyzstan
-
 Laos
Laos
-
 Latvia
-
 Lebanon
-
 Lesotho
-
 Libya
Libya
-
 Lithuania
-
 Luxembourg
-
 Madagascar
-
 Malaysia
-
 Malta
Malta
-
 Mauritius
-
 Mexico
-
 Moldova
-
 Mongolia
-
 Montenegro
-
 Morocco
-
 Mozambique
-
 Myanmar
-
 Namibia
-
 Nepal
Nepal
-
 Netherlands
-
 New Zealand
-
 Nigeria
-
 North Macedonia
-
 Norway
-
 Oman
Oman
-
 Pakistan
-
 Palestine
-
 Panama
-
 Papua New Guinea
-
 Paraguay
-
 Peru
Peru
-
 Philippines
-
 Poland
-
 Portugal
-
 Puerto Rico
-
 Qatar
Qatar
-
 Reunion
-
 Romania
-
 Rwanda
-
 Saudi Arabia
-
 Serbia
-
 Singapore
-
 Slovakia
-
 Slovenia
-
 Somalia
-
 South Africa
-
 Spain
Spain
-
 Sri Lanka
-
 Sweden
-
 Switzerland
-
 Syria
Syria
-
 Taiwan
-
 Tajikistan
-
 Tanzania
-
 Thailand
-
 Trinidad and Tobago
-
 Tunisia
-
 Turkey
-
 UAE
UAE
-
 Uganda
-
 Ukraine
-
 United Kingdom
-
United States
-
 Uruguay
-
 Uzbekistan
-
 Venezuela
-
 Vietnam
-
 Yemen
Yemen
-
 Zambia
-
 Zimbabwe
- Forex
- Crypto
