
SoFi stock gains 3.5% as net revenue jumps 43% year over year

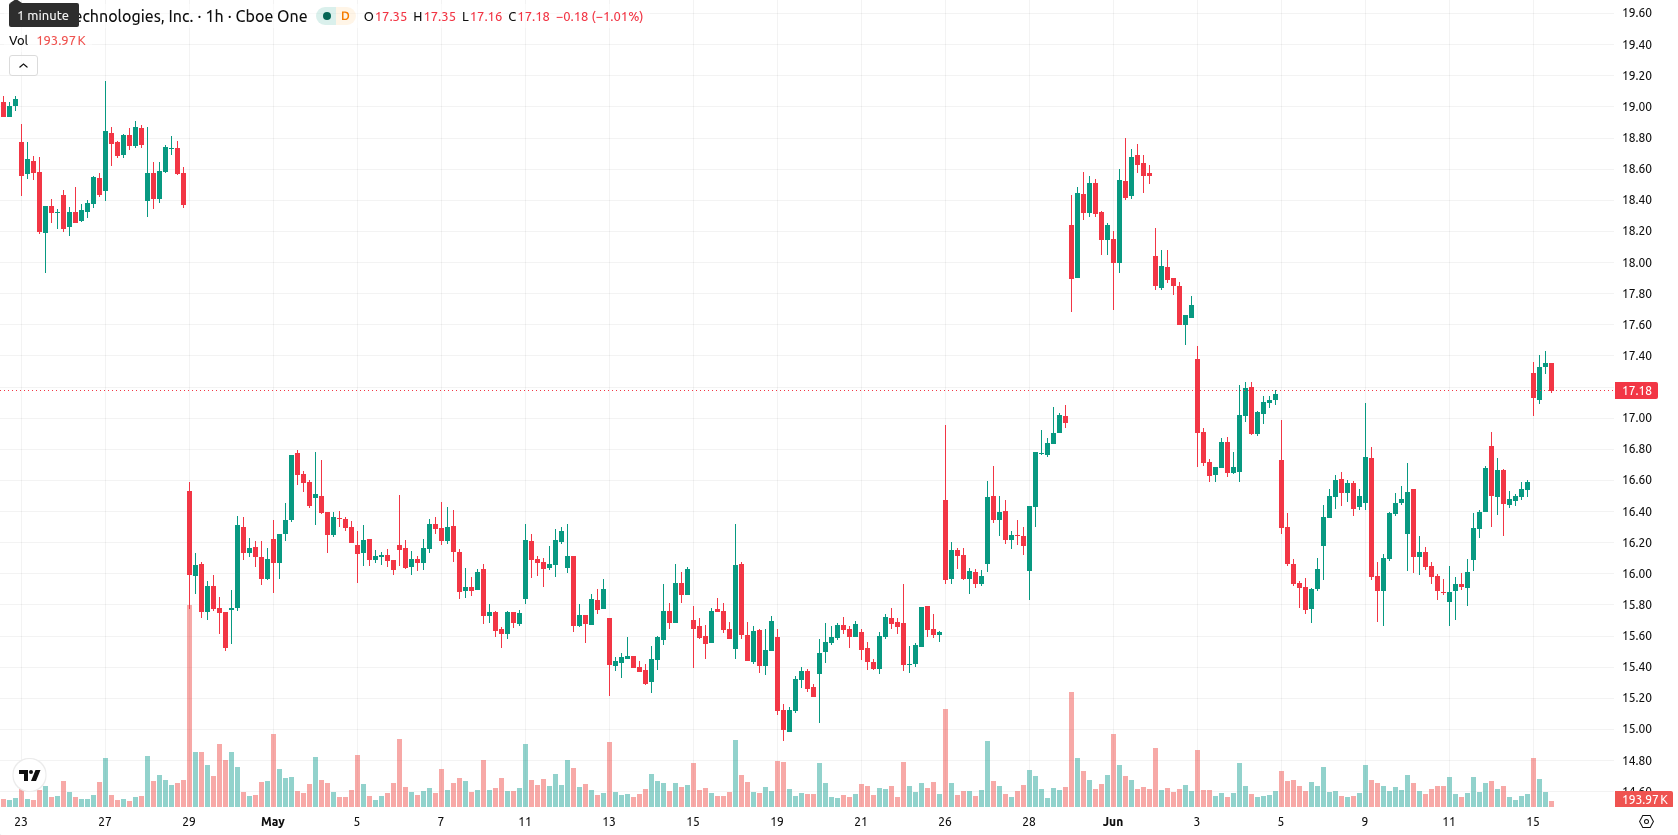
SoFi Technologies, Inc (SOFI) stock is trading at $17.16, up 3.5% for the day. The price has climbed above its key short- and medium-term moving averages while remaining below major long-term averages.
Highlights
- SoFi Technologies delivered strong Q1 2026 fundamentals, with GAAP net revenue up 43% year over year to $1.10 billion.
- Membership growth of 35% and a 62% increase in adjusted EBITDA to $339.9 million signal robust operating leverage and margin expansion.
- Technicals indicate short-term bullish momentum and buyer dominance, with price expected to range between $16.51 and $18.27 over the next several sessions.
Profitability advances and customer growth drive revenue surge
SoFi Technologies reported robust financial results for the first quarter of 2026, with GAAP net revenue rising 43% year over year to $1.10 billion. This rapid top-line growth is supported by a 35% increase in member count, reaching 14.7 million, and a 39% expansion in product offerings, both of which reflect strong demand and customer acquisition momentum. Net income came in at $166.7 million with diluted EPS of $0.12, while adjusted EBITDA improved by 62% to $339.9 million, highlighting meaningful advances in profitability and operational efficiency.
Divergent momentum signals as overbought conditions emerge intraday
On the hourly chart, SOFI is trading above the MA-20 ($16.52) and MA-50 ($16.40), while on the daily timeframe it remains below the MA-200 ($22.85). The Ichimoku Kijun level at $16.53 serves as immediate support. Technical indicators show the MACD in buy mode, and the ADX is neutral, reflecting active but non-trending momentum. The RSI signals a buy, but both the CCI and BBP register overbought conditions, suggesting buyer dominance intraday. Stoch RSI gives a strong sell signal, introducing notable divergence among oscillators, while the Awesome Oscillator is aligned with the bullish move.
Directional bias favors gains as volatility defines expected range
In the short term, SOFI is expected to fluctuate within the $16.51 to $18.27 band as typical volatility. The up probability stands at 70%, favoring further gains over the next 2–3 sessions. The baseline scenario sees the price consolidating between immediate support and resistance levels. A bullish scenario could unfold if price breaks above resistance, targeting higher within the range, while a bearish turn would be implied if SOFI falls below the Kijun support near $16.53, risking a move to the lower end of the projected band.
Earlier, analysts noted that brokerage-imposed restrictions can shape trading behavior and volatility in high-profile listings, highlighting the role of retail platforms like SoFi in enforcing IPO share lock-up periods. With SoFi's impressive member growth and financial performance now fueling renewed interest in its stock, traders should monitor whether improved fundamentals attract broader participation and influence price action beyond near-term technical ranges.


Latest SoFi News


-
 Afghanistan
-
 Albania
-
 Algeria
-
 Angola
-
 Argentina
-
 Armenia
-
 Australia
-
 Austria
-
 Azerbaijan
-
 Bahamas
-
 Bahrain
-
 Bangladesh
-
 Belarus
-
 Belgium
-
 Bolivia
-
 Botswana
-
 Brazil
-
 Brunei
-
 Bulgaria
-
 Cambodia
-
 Cameroon
-
 Canada
-
 Chile
Chile
-
 China
China
-
 Colombia
-
 Congo
Congo
-
 Costa Rica
-
 Cote d'Ivoire
-
 Croatia
-
 Cuba
Cuba
-
 Cyprus
-
 Czechia
-
 DR Congo
-
 Denmark
-
 Dominican Republic
-
 Ecuador
-
 Egypt
Egypt
-
 El Salvador
-
 Estonia
-
 Eswatini
-
 Ethiopia
-
 Finland
-
 France
-
 Georgia
-
 Germany
-
 Ghana
Ghana
-
 Greece
-
 Haiti
Haiti
-
 Hong Kong
-
 Hungary
-
 India
India
-
 Indonesia
-
 Iran, Islamic republic
-
 Iraq
Iraq
-
 Ireland
-
 Israel
-
 Italy
Italy
-
 Jamaica
-
 Japan
Japan
-
 Jordan
-
 Kazakhstan
-
 Kenya
Kenya
-
 Korea
Korea
-
 Kuwait
-
 Kyrgyzstan
-
 Laos
Laos
-
 Latvia
-
 Lebanon
-
 Lesotho
-
 Libya
Libya
-
 Lithuania
-
 Luxembourg
-
 Madagascar
-
 Malaysia
-
 Malta
Malta
-
 Mauritius
-
 Mexico
-
 Moldova
-
 Mongolia
-
 Montenegro
-
 Morocco
-
 Mozambique
-
 Myanmar
-
 Namibia
-
 Nepal
Nepal
-
 Netherlands
-
 New Zealand
-
 Nigeria
-
 North Macedonia
-
 Norway
-
 Oman
Oman
-
 Pakistan
-
 Palestine
-
 Panama
-
 Papua New Guinea
-
 Paraguay
-
 Peru
Peru
-
 Philippines
-
 Poland
-
 Portugal
-
 Puerto Rico
-
 Qatar
Qatar
-
 Reunion
-
 Romania
-
 Rwanda
-
 Saudi Arabia
-
 Serbia
-
 Singapore
-
 Slovakia
-
 Slovenia
-
 Somalia
-
 South Africa
-
 Spain
Spain
-
 Sri Lanka
-
 Sweden
-
 Switzerland
-
 Syria
Syria
-
 Taiwan
-
 Tajikistan
-
 Tanzania
-
 Thailand
-
 Trinidad and Tobago
-
 Tunisia
-
 Turkey
-
 UAE
UAE
-
 Uganda
-
 Ukraine
-
 United Kingdom
-
United States
-
 Uruguay
-
 Uzbekistan
-
 Venezuela
-
 Vietnam
-
 Yemen
Yemen
-
 Zambia
-
 Zimbabwe
- Forex
- Crypto
