
CME Group stock falls 4.76% as sellers control the short-term trend

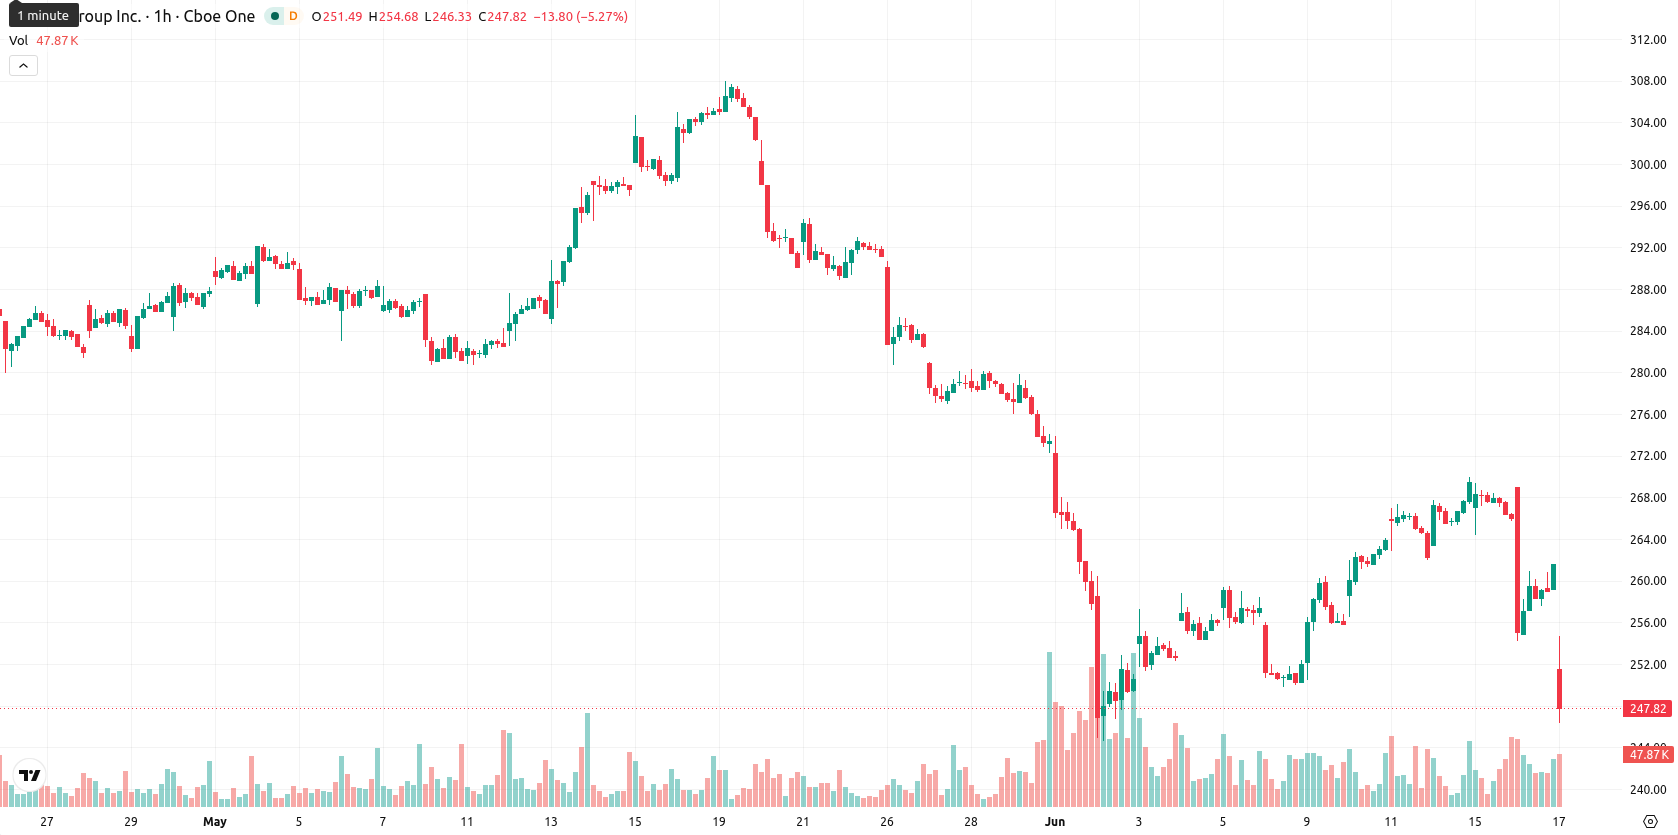
CME Group Inc. (CME) stock is trading at $249.15, marking a daily decline of 4.76%. The price sits below its key moving averages, reflecting a continued downward trend in the short and long term.
Highlights
- Regulators expanded CME Group’s cross-margining arrangement, enabling broader institutional access and potential operational efficiency gains.
- CME Group received approval as a central counterparty for updated ISDA clearing models, with global netting enforceability enhancements underway.
- CME trades below key moving averages, with bearish momentum dominating; price is likely to fluctuate between $242.19 and $265.06 short term.
Broader client access after regulatory approvals drive efficiency outlook
The SEC and Commodity Futures Trading Commission approved an exemptive order and proposed rule change on June 17, 2026, permitting the extension of the Fixed Income Clearing Corporation and CME Group cross-margining arrangement to a wider client base. This regulatory action broadens institutional access to cross-margining benefits, potentially increasing operational efficiencies and client activity for CME Group. CME Group was also named as one of the three approved central counterparties by ISDA for updated clearing models, while ISDA's CEO confirmed that new netting standards are being incorporated into global opinions frameworks to support enforceability. These developments accompany recent trading performance, though price action has remained under broader selling pressure.
Bearish technical momentum as price under multi-period resistance
CME is trading below its MA-20 ($264.23), MA-50 ($261.15), and remains under the long-term MA-200 ($281.84). The Ichimoku Kijun line at $261.88 is the nearest resistance. Momentum indicators highlight persistent bearishness, with both MACD and ADX signaling sell. RSI is at 47.65 (Sell), CCI also calls Sell, and Bull/Bear Power (BBP) is in Oversold territory, showing sellers dominate intraday action. Stoch RSI and the Awesome Oscillator both register as Neutral, pointing to some conflicting short-term signals. The price has settled mid-range for the day amid high volatility.
Sideways bias persists as downside risk outpaces rebound odds
Over the next few days, CME is expected to move within the $242.19–$265.06 volatility band relative to current levels. The probability of further downside is estimated at 62%, with a 38% chance of a rebound. The baseline scenario suggests that price remains in the current sideways corridor, while a bullish breakout hinges on a close above resistance at $261.88. Should the price fall below $242.19, a bearish extension is likely.
Earlier, analysts noted that CME Group faced persistent selling pressure with a prevailing bearish bias. The current environment not only reinforces this negative outlook but introduces regulatory and operational shifts, suggesting that traders should closely monitor for potential volatility as the market digests these changes and assesses the likelihood of a break below $242.19 support.


Latest CME Group News


-
 Afghanistan
-
 Albania
-
 Algeria
-
 Angola
-
 Argentina
-
 Armenia
-
 Australia
-
 Austria
-
 Azerbaijan
-
 Bahamas
-
 Bahrain
-
 Bangladesh
-
 Belarus
-
 Belgium
-
 Bolivia
-
 Botswana
-
 Brazil
-
 Brunei
-
 Bulgaria
-
 Cambodia
-
 Cameroon
-
 Canada
-
 Chile
Chile
-
 China
China
-
 Colombia
-
 Congo
Congo
-
 Costa Rica
-
 Cote d'Ivoire
-
 Croatia
-
 Cuba
Cuba
-
 Cyprus
-
 Czechia
-
 DR Congo
-
 Denmark
-
 Dominican Republic
-
 Ecuador
-
 Egypt
Egypt
-
 El Salvador
-
 Estonia
-
 Eswatini
-
 Ethiopia
-
 Finland
-
 France
-
 Georgia
-
 Germany
-
 Ghana
Ghana
-
 Greece
-
 Haiti
Haiti
-
 Hong Kong
-
 Hungary
-
 India
India
-
 Indonesia
-
 Iran, Islamic republic
-
 Iraq
Iraq
-
 Ireland
-
 Israel
-
 Italy
Italy
-
 Jamaica
-
 Japan
Japan
-
 Jordan
-
 Kazakhstan
-
 Kenya
Kenya
-
 Korea
Korea
-
 Kuwait
-
 Kyrgyzstan
-
 Laos
Laos
-
 Latvia
-
 Lebanon
-
 Lesotho
-
 Libya
Libya
-
 Lithuania
-
 Luxembourg
-
 Madagascar
-
 Malaysia
-
 Malta
Malta
-
 Mauritius
-
 Mexico
-
 Moldova
-
 Mongolia
-
 Montenegro
-
 Morocco
-
 Mozambique
-
 Myanmar
-
 Namibia
-
 Nepal
Nepal
-
 Netherlands
-
 New Zealand
-
 Nigeria
-
 North Macedonia
-
 Norway
-
 Oman
Oman
-
 Pakistan
-
 Palestine
-
 Panama
-
 Papua New Guinea
-
 Paraguay
-
 Peru
Peru
-
 Philippines
-
 Poland
-
 Portugal
-
 Puerto Rico
-
 Qatar
Qatar
-
 Reunion
-
 Romania
-
 Rwanda
-
 Saudi Arabia
-
 Serbia
-
 Singapore
-
 Slovakia
-
 Slovenia
-
 Somalia
-
 South Africa
-
 Spain
Spain
-
 Sri Lanka
-
 Sweden
-
 Switzerland
-
 Syria
Syria
-
 Taiwan
-
 Tajikistan
-
 Tanzania
-
 Thailand
-
 Trinidad and Tobago
-
 Tunisia
-
 Turkey
-
 UAE
UAE
-
 Uganda
-
 Ukraine
-
 United Kingdom
-
United States
-
 Uruguay
-
 Uzbekistan
-
 Venezuela
-
 Vietnam
-
 Yemen
Yemen
-
 Zambia
-
 Zimbabwe
- Forex
- Crypto
