
Heavy selling pressure sends CME Group stock sharply lower

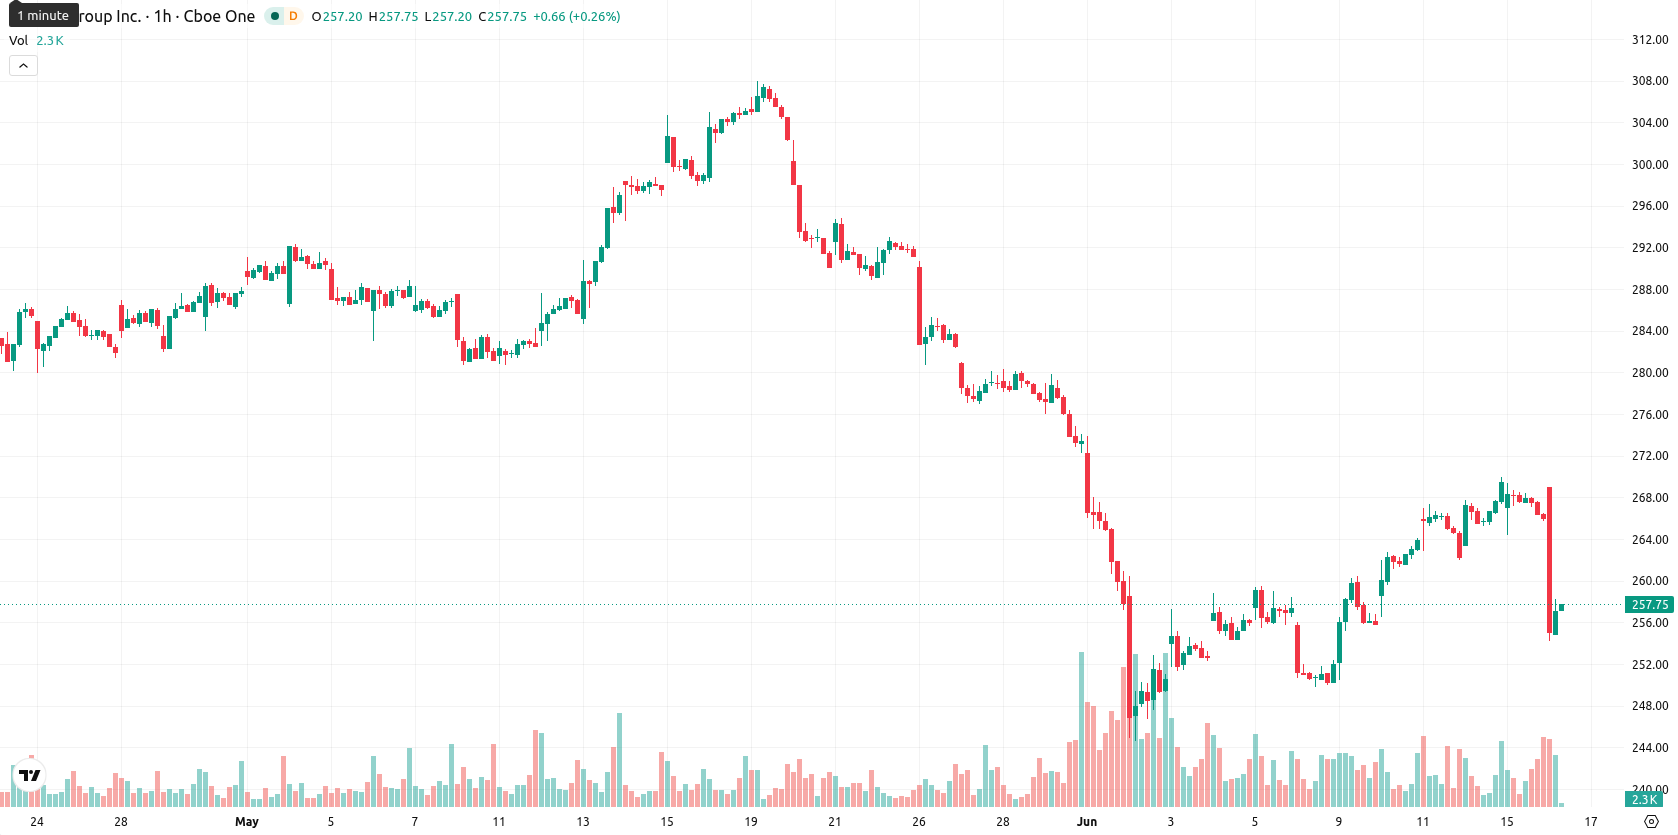
CME Group Inc. (CME) stock is trading at $257.14 after a sharp daily decline of 3.36%. The price sits beneath its key moving averages, pointing to ongoing weakness in both the short and longer term.
Highlights
- CME/USD faces sustained short- and medium-term selling pressure, with price trading well below major moving averages.
- Bearish momentum dominates as multiple indicators signal oversold conditions, confirming strong downside with minimal divergence.
- Price may consolidate between 251.17 and 263.11, with a 75% probability of further declines if support breaks.
Bearish momentum as support breaks and oscillators flash sell
On the hourly chart, CME is trading below both the MA-20 ($265.43) and MA-50 ($260.81), while the daily price is well below the MA-200 at $281.87. The Ichimoku Kijun level at $262.12 serves as immediate resistance. Momentum indicators present a strongly negative profile: RSI signals Sell at 29.15, with Stoch RSI, CCI, and BBP all marking oversold or decisively bearish conditions, and the Awesome Oscillator delivering a strong sell reading. ADX confirms sell momentum, MACD is neutral, and there are no bullish divergences across the oscillators.
Range-bound volatility as downside risk dominates short-term
In the short term, CME price action is likely to remain volatile within a range of $251.17–$263.11, with downside having a 75% probability. Baseline expectations point to consolidation between these levels. Upside scenarios would require a break above the Kijun resistance at $262.12, while any breach of $251 support would open the door to additional losses.
Earlier, analysts noted that CME Group faced persistent selling pressure with a clear bearish bias prevailing across multiple timeframes. The present analysis reinforces this outlook, highlighting sustained weakness and warning that any break below the $251 support could accelerate further losses in the days ahead.


Latest CME Group News


-
 Afghanistan
-
 Albania
-
 Algeria
-
 Angola
-
 Argentina
-
 Armenia
-
 Australia
-
 Austria
-
 Azerbaijan
-
 Bahamas
-
 Bahrain
-
 Bangladesh
-
 Belarus
-
 Belgium
-
 Bolivia
-
 Botswana
-
 Brazil
-
 Brunei
-
 Bulgaria
-
 Cambodia
-
 Cameroon
-
 Canada
-
 Chile
Chile
-
 China
China
-
 Colombia
-
 Congo
Congo
-
 Costa Rica
-
 Cote d'Ivoire
-
 Croatia
-
 Cuba
Cuba
-
 Cyprus
-
 Czechia
-
 DR Congo
-
 Denmark
-
 Dominican Republic
-
 Ecuador
-
 Egypt
Egypt
-
 El Salvador
-
 Estonia
-
 Eswatini
-
 Ethiopia
-
 Finland
-
 France
-
 Georgia
-
 Germany
-
 Ghana
Ghana
-
 Greece
-
 Haiti
Haiti
-
 Hong Kong
-
 Hungary
-
 India
India
-
 Indonesia
-
 Iran, Islamic republic
-
 Iraq
Iraq
-
 Ireland
-
 Israel
-
 Italy
Italy
-
 Jamaica
-
 Japan
Japan
-
 Jordan
-
 Kazakhstan
-
 Kenya
Kenya
-
 Korea
Korea
-
 Kuwait
-
 Kyrgyzstan
-
 Laos
Laos
-
 Latvia
-
 Lebanon
-
 Lesotho
-
 Libya
Libya
-
 Lithuania
-
 Luxembourg
-
 Madagascar
-
 Malaysia
-
 Malta
Malta
-
 Mauritius
-
 Mexico
-
 Moldova
-
 Mongolia
-
 Montenegro
-
 Morocco
-
 Mozambique
-
 Myanmar
-
 Namibia
-
 Nepal
Nepal
-
 Netherlands
-
 New Zealand
-
 Nigeria
-
 North Macedonia
-
 Norway
-
 Oman
Oman
-
 Pakistan
-
 Palestine
-
 Panama
-
 Papua New Guinea
-
 Paraguay
-
 Peru
Peru
-
 Philippines
-
 Poland
-
 Portugal
-
 Puerto Rico
-
 Qatar
Qatar
-
 Reunion
-
 Romania
-
 Rwanda
-
 Saudi Arabia
-
 Serbia
-
 Singapore
-
 Slovakia
-
 Slovenia
-
 Somalia
-
 South Africa
-
 Spain
Spain
-
 Sri Lanka
-
 Sweden
-
 Switzerland
-
 Syria
Syria
-
 Taiwan
-
 Tajikistan
-
 Tanzania
-
 Thailand
-
 Trinidad and Tobago
-
 Tunisia
-
 Turkey
-
 UAE
UAE
-
 Uganda
-
 Ukraine
-
 United Kingdom
-
United States
-
 Uruguay
-
 Uzbekistan
-
 Venezuela
-
 Vietnam
-
 Yemen
Yemen
-
 Zambia
-
 Zimbabwe
- Forex
- Crypto
