
Arm stock extends losses as sellers retain control across multiple timeframes

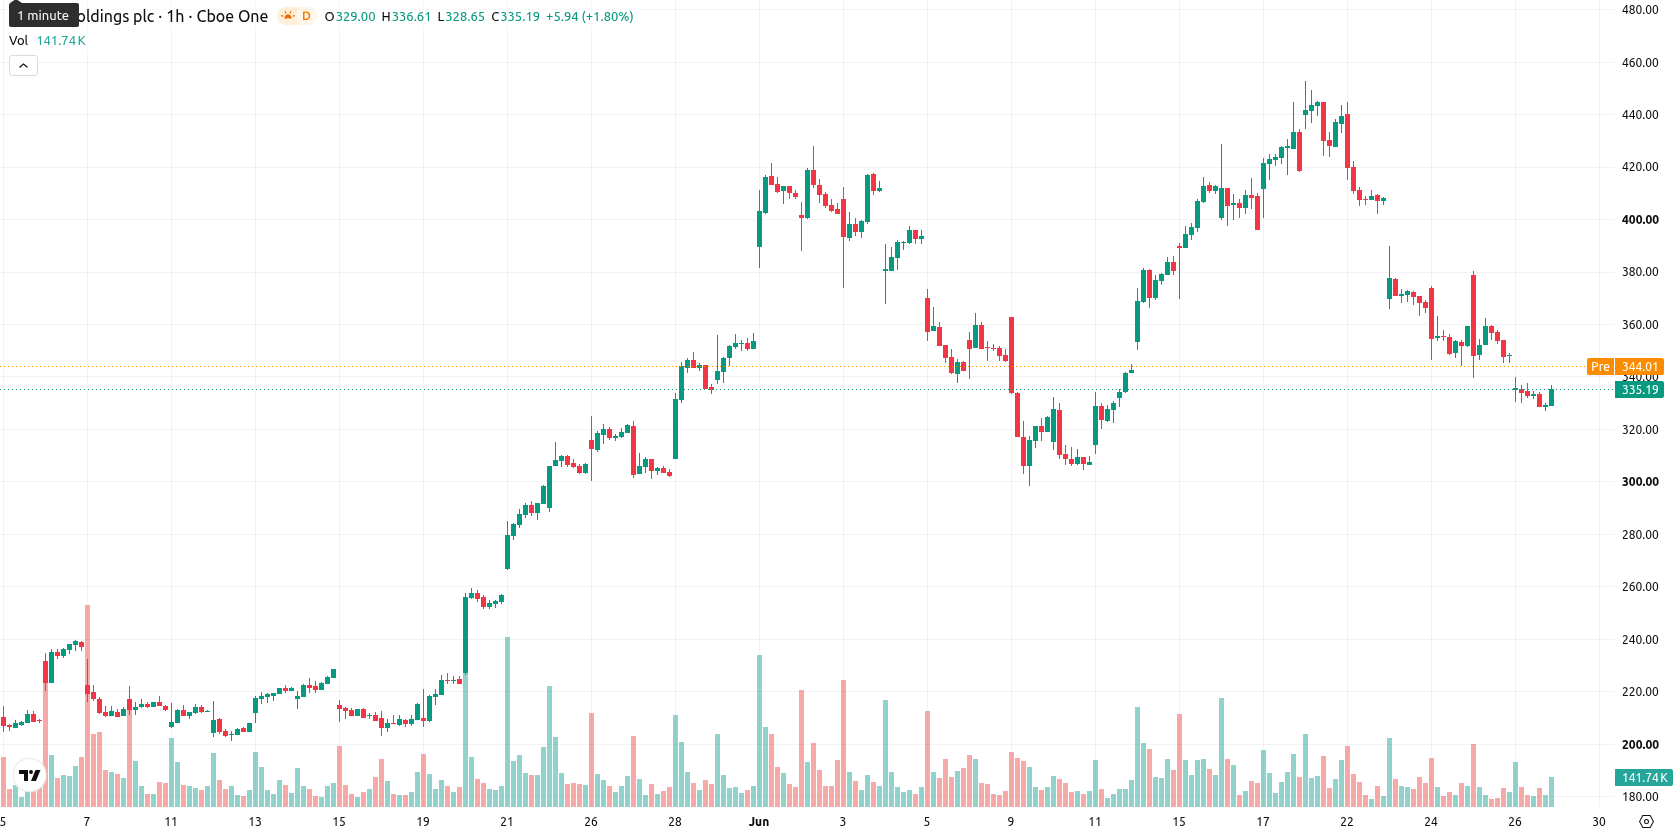
Arm (ARM) stock is trading at $334.27 after falling 3.87% on the day, with shares positioned below their main short- and medium-term moving averages but still above long-term levels.
Highlights
- Arm trades below short- and medium-term moving averages, signaling persistent bearish momentum amid recent high volatility.
- Intraday technical indicators predominantly signal strong selling pressure, though oscillators indicate potential for a short-term oversold bounce.
- Price is projected to consolidate between $281.57 and $386.97, with a 68% probability of further downside in upcoming sessions.
Technical signals conflict as bearish momentum meets oversold bounce
On the H1 chart, ARM has dropped below its MA-20 ($345.94) and MA-50 ($383.55), while staying above its long-term MA-200 at $173.48. The Ichimoku Kijun is at $353.66 and now represents immediate resistance. For momentum and oscillators: the Moving Average Convergence Divergence (MACD) and Average Directional Index (ADX) signal Sell, while the Relative Strength Index (RSI) is at 32.47 (Sell), Commodity Channel Index (CCI) also points to Sell, and Bull/Bear Power confirms an oversold status. However, Stochastic RSI indicates a strong oversold bounce with a Strong Buy reading, and the Awesome Oscillator remains Neutral, capturing the intraday conflict in market sentiment.
Downside scenario favored as consolidation persists within wide band
For the next few sessions, price action is likely to consolidate within a volatility band between $281.57 and $386.97. Probability models suggest a 32% chance of a move higher versus a 68% likelihood of further downside. Upside scenarios require a climb above immediate resistance at $353.66, while a breakdown through support could see a test toward the $281.57 area.
Earlier, analysts noted that Arm shares were experiencing persistent selling pressure alongside mixed technical momentum, producing an unsettled near-term outlook. The current technical deterioration, underscored by a majority of momentum indicators turning bearish, raises the probability of an extended downside move, making the $281.57 support zone a critical level for traders to monitor in the coming sessions.


-
 Afghanistan
-
 Albania
-
 Algeria
-
 Angola
-
 Argentina
-
 Armenia
-
 Australia
-
 Austria
-
 Azerbaijan
-
 Bahamas
-
 Bahrain
-
 Bangladesh
-
 Belarus
-
 Belgium
-
 Bolivia
-
 Botswana
-
 Brazil
-
 Brunei
-
 Bulgaria
-
 Cambodia
-
 Cameroon
-
 Canada
-
 Chile
Chile
-
 China
China
-
 Colombia
-
 Congo
Congo
-
 Costa Rica
-
 Cote d'Ivoire
-
 Croatia
-
 Cuba
Cuba
-
 Cyprus
-
 Czechia
-
 DR Congo
-
 Denmark
-
 Dominican Republic
-
 Ecuador
-
 Egypt
Egypt
-
 El Salvador
-
 Estonia
-
 Eswatini
-
 Ethiopia
-
 Finland
-
 France
-
 Georgia
-
 Germany
-
 Ghana
Ghana
-
 Greece
-
 Haiti
Haiti
-
 Hong Kong
-
 Hungary
-
 India
India
-
 Indonesia
-
 Iran, Islamic republic
-
 Iraq
Iraq
-
 Ireland
-
 Israel
-
 Italy
Italy
-
 Jamaica
-
 Japan
Japan
-
 Jordan
-
 Kazakhstan
-
 Kenya
Kenya
-
 Korea
Korea
-
 Kuwait
-
 Kyrgyzstan
-
 Laos
Laos
-
 Latvia
-
 Lebanon
-
 Lesotho
-
 Libya
Libya
-
 Lithuania
-
 Luxembourg
-
 Madagascar
-
 Malaysia
-
 Malta
Malta
-
 Mauritius
-
 Mexico
-
 Moldova
-
 Mongolia
-
 Montenegro
-
 Morocco
-
 Mozambique
-
 Myanmar
-
 Namibia
-
 Nepal
Nepal
-
 Netherlands
-
 New Zealand
-
 Nigeria
-
 North Macedonia
-
 Norway
-
 Oman
Oman
-
 Pakistan
-
 Palestine
-
 Panama
-
 Papua New Guinea
-
 Paraguay
-
 Peru
Peru
-
 Philippines
-
 Poland
-
 Portugal
-
 Puerto Rico
-
 Qatar
Qatar
-
 Reunion
-
 Romania
-
 Rwanda
-
 Saudi Arabia
-
 Serbia
-
 Singapore
-
 Slovakia
-
 Slovenia
-
 Somalia
-
 South Africa
-
 Spain
Spain
-
 Sri Lanka
-
 Sweden
-
 Switzerland
-
 Syria
Syria
-
 Taiwan
-
 Tajikistan
-
 Tanzania
-
 Thailand
-
 Trinidad and Tobago
-
 Tunisia
-
 Turkey
-
 UAE
UAE
-
 Uganda
-
 Ukraine
-
 United Kingdom
-
United States
-
 Uruguay
-
 Uzbekistan
-
 Venezuela
-
 Vietnam
-
 Yemen
Yemen
-
 Zambia
-
 Zimbabwe
- Forex
- Crypto
