
+8.50% for Tesla stock as major momentum indicators diverge

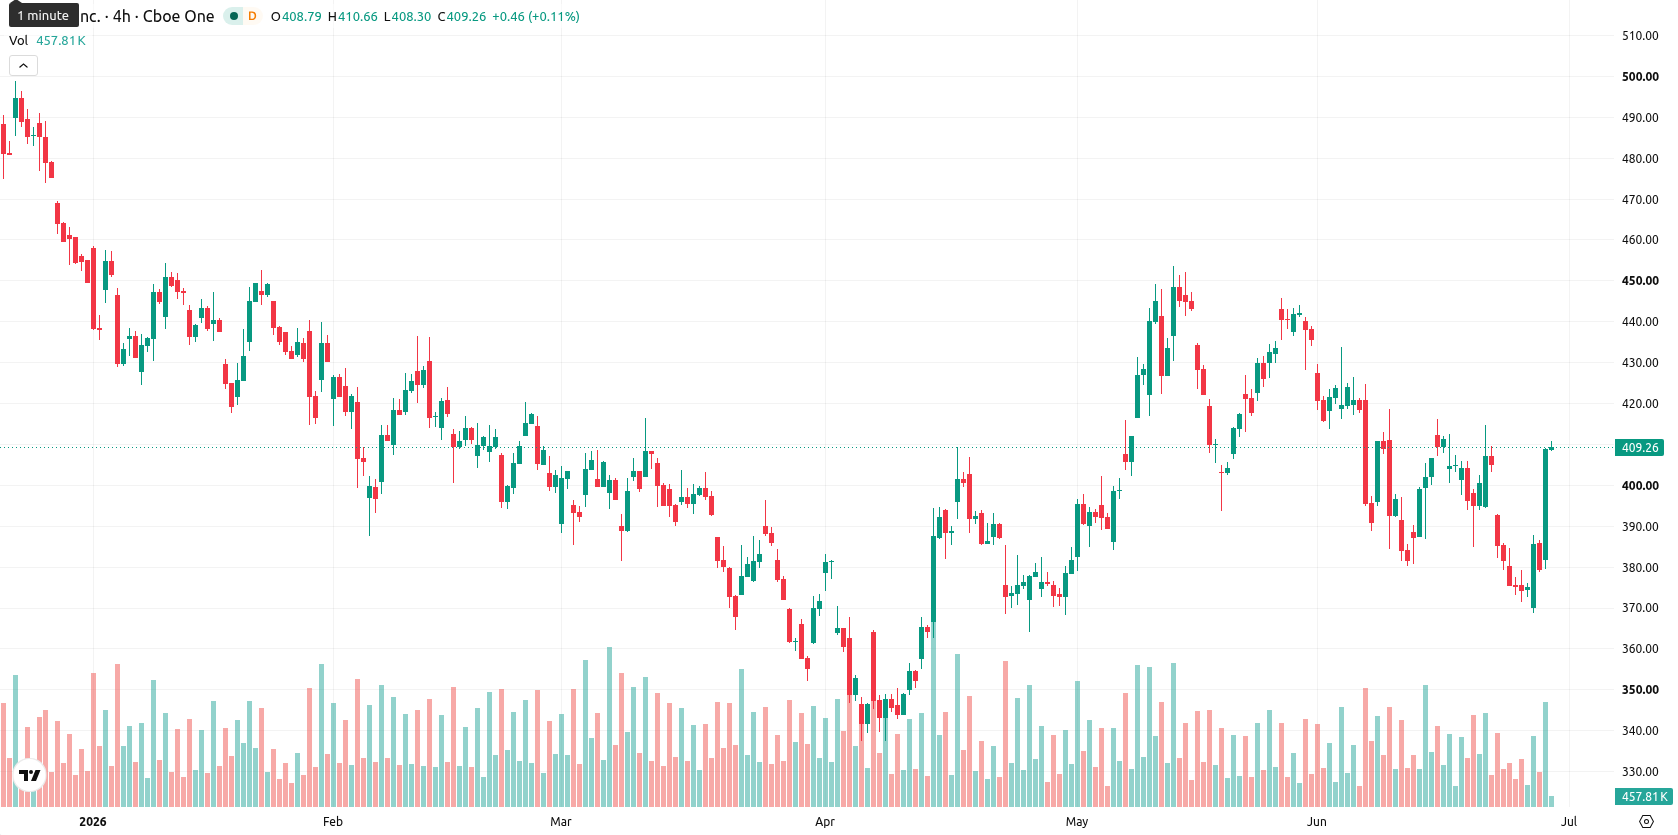
Tesla (TSLA) stock is trading at $409.04 after surging 8.5% today, closing near the session highs and exhibiting high intraday volatility. The price currently stands above its key short- and medium-term moving averages but remains below longer-term trend markers.
Highlights
- Middle East tensions escalated after Iran targeted U.S. bases in Bahrain and Kuwait, spiking geopolitical risk and threatening regional stability.
- Investors face heightened risk of energy price shocks and potential global trade disruptions due to the increased conflict.
- TSLA posted an 8.5% surge with pronounced bullish momentum and high volatility, though technical indicators remain mixed and signal heightened uncertainty within a $397–$428.96 expected range.
Energy shock risk rises as Middle East conflict escalates
Markets have entered a volatile period after Iran launched new strikes against U.S. bases in Bahrain and Kuwait before Sunday, escalating geopolitical risk in the Middle East and increasing the threat of broader conflict or disruption to the Strait of Hormuz, according to Finance Yahoo. This escalation increases economic instability through the risk of energy price shocks and potential strain on global trade flows.
Divergent momentum signals as price straddles key technical thresholds
On the technical front, TSLA is trading above the 20-period ($393.65) and 50-period ($407.32) moving averages on the H4 timeframe, while remaining below the 200-period ($417.93) moving average on the daily chart. The Ichimoku Kijun at $392.3 serves as immediate support. Relative Strength Index (RSI) is at 53.47 (Buy), but both the Stochastic RSI and Bull/Bear Power indicate overbought conditions and strong buyer dominance. Meanwhile, Commodity Channel Index (CCI) and Awesome Oscillator are neutral, and the Moving Average Convergence Divergence (MACD) signals a strong sell with the Average Directional Index (ADX) remaining neutral. This points to a clear divergence across momentum indicators and oscillators, highlighting a backdrop of elevated uncertainty.
Directional bias remains split as volatility constrains short-term outlook
Over the next two to three trading days, TSLA is expected to remain within a typical volatility band between $397 and $428.96. The likelihood of an upward move stands at 59%, with a 41% probability of a downward move. Baseline expectations are for TSLA to continue oscillating inside this corridor; a break above the upper boundary would open room for further gains, while a drop below the immediate support near the Kijun level would shift the bias toward retracement.
Earlier, analysts noted that Tesla's ability to sustain momentum would depend on a combination of technology advances, regulatory clarity, and the balance of buying strength versus overbought conditions. The current backdrop of heightened geopolitical risk and divergent technical momentum suggests traders should closely monitor the $428.96 resistance, as a decisive break could trigger a volatility-driven upside extension.


Latest Tesla News


-
 Afghanistan
-
 Albania
-
 Algeria
-
 Angola
-
 Argentina
-
 Armenia
-
 Australia
-
 Austria
-
 Azerbaijan
-
 Bahamas
-
 Bahrain
-
 Bangladesh
-
 Belarus
-
 Belgium
-
 Bolivia
-
 Botswana
-
 Brazil
-
 Brunei
-
 Bulgaria
-
 Cambodia
-
 Cameroon
-
 Canada
-
 Chile
Chile
-
 China
China
-
 Colombia
-
 Congo
Congo
-
 Costa Rica
-
 Cote d'Ivoire
-
 Croatia
-
 Cuba
Cuba
-
 Cyprus
-
 Czechia
-
 DR Congo
-
 Denmark
-
 Dominican Republic
-
 Ecuador
-
 Egypt
Egypt
-
 El Salvador
-
 Estonia
-
 Eswatini
-
 Ethiopia
-
 Finland
-
 France
-
 Georgia
-
 Germany
-
 Ghana
Ghana
-
 Greece
-
 Haiti
Haiti
-
 Hong Kong
-
 Hungary
-
 India
India
-
 Indonesia
-
 Iran, Islamic republic
-
 Iraq
Iraq
-
 Ireland
-
 Israel
-
 Italy
Italy
-
 Jamaica
-
 Japan
Japan
-
 Jordan
-
 Kazakhstan
-
 Kenya
Kenya
-
 Korea
Korea
-
 Kuwait
-
 Kyrgyzstan
-
 Laos
Laos
-
 Latvia
-
 Lebanon
-
 Lesotho
-
 Libya
Libya
-
 Lithuania
-
 Luxembourg
-
 Madagascar
-
 Malaysia
-
 Malta
Malta
-
 Mauritius
-
 Mexico
-
 Moldova
-
 Mongolia
-
 Montenegro
-
 Morocco
-
 Mozambique
-
 Myanmar
-
 Namibia
-
 Nepal
Nepal
-
 Netherlands
-
 New Zealand
-
 Nigeria
-
 North Macedonia
-
 Norway
-
 Oman
Oman
-
 Pakistan
-
 Palestine
-
 Panama
-
 Papua New Guinea
-
 Paraguay
-
 Peru
Peru
-
 Philippines
-
 Poland
-
 Portugal
-
 Puerto Rico
-
 Qatar
Qatar
-
 Reunion
-
 Romania
-
 Rwanda
-
 Saudi Arabia
-
 Serbia
-
 Singapore
-
 Slovakia
-
 Slovenia
-
 Somalia
-
 South Africa
-
 Spain
Spain
-
 Sri Lanka
-
 Sweden
-
 Switzerland
-
 Syria
Syria
-
 Taiwan
-
 Tajikistan
-
 Tanzania
-
 Thailand
-
 Trinidad and Tobago
-
 Tunisia
-
 Turkey
-
 UAE
UAE
-
 Uganda
-
 Ukraine
-
 United Kingdom
-
United States
-
 Uruguay
-
 Uzbekistan
-
 Venezuela
-
 Vietnam
-
 Yemen
Yemen
-
 Zambia
-
 Zimbabwe
- Forex
- Crypto
