

Nordson (NDSN) stock is trading at $300.01, ending the session with a modest decline. The price is positioned below its short-term moving average but still holds above intermediate and long-term averages.
Highlights
- NDSN maintains a bullish medium- to long-term technical structure despite short-term resistance and recent minor decline.
- Momentum indicators present mixed signals, with some suggesting oversold conditions and others reflecting ongoing buying strength.
- Price is expected to consolidate between $290.75 and $309.27, with a moderately higher probability of an upward breakout.
Mixed signals and resistance define short-term price uncertainty
On the technical front, NDSN closed at $300.01, falling below its 20-day moving average while remaining above the 50-day and 200-day levels. The Ichimoku Kijun level at $300.12 stands as immediate resistance for near-term trading. Indicator signals are mixed: the Moving Average Convergence Divergence (MACD) presents a Strong Buy, Average Directional Index (ADX) is Neutral, and the Relative Strength Index (RSI) reads 50.7 in Buy territory. Both Stochastic RSI and Bull/Bear Power highlight oversold conditions, whereas the Commodity Channel Index (CCI) leans Sell. Bull/Bear Power points to intraday seller dominance and the Awesome Oscillator is Neutral, underscoring divergence and uncertainty in short-term direction.
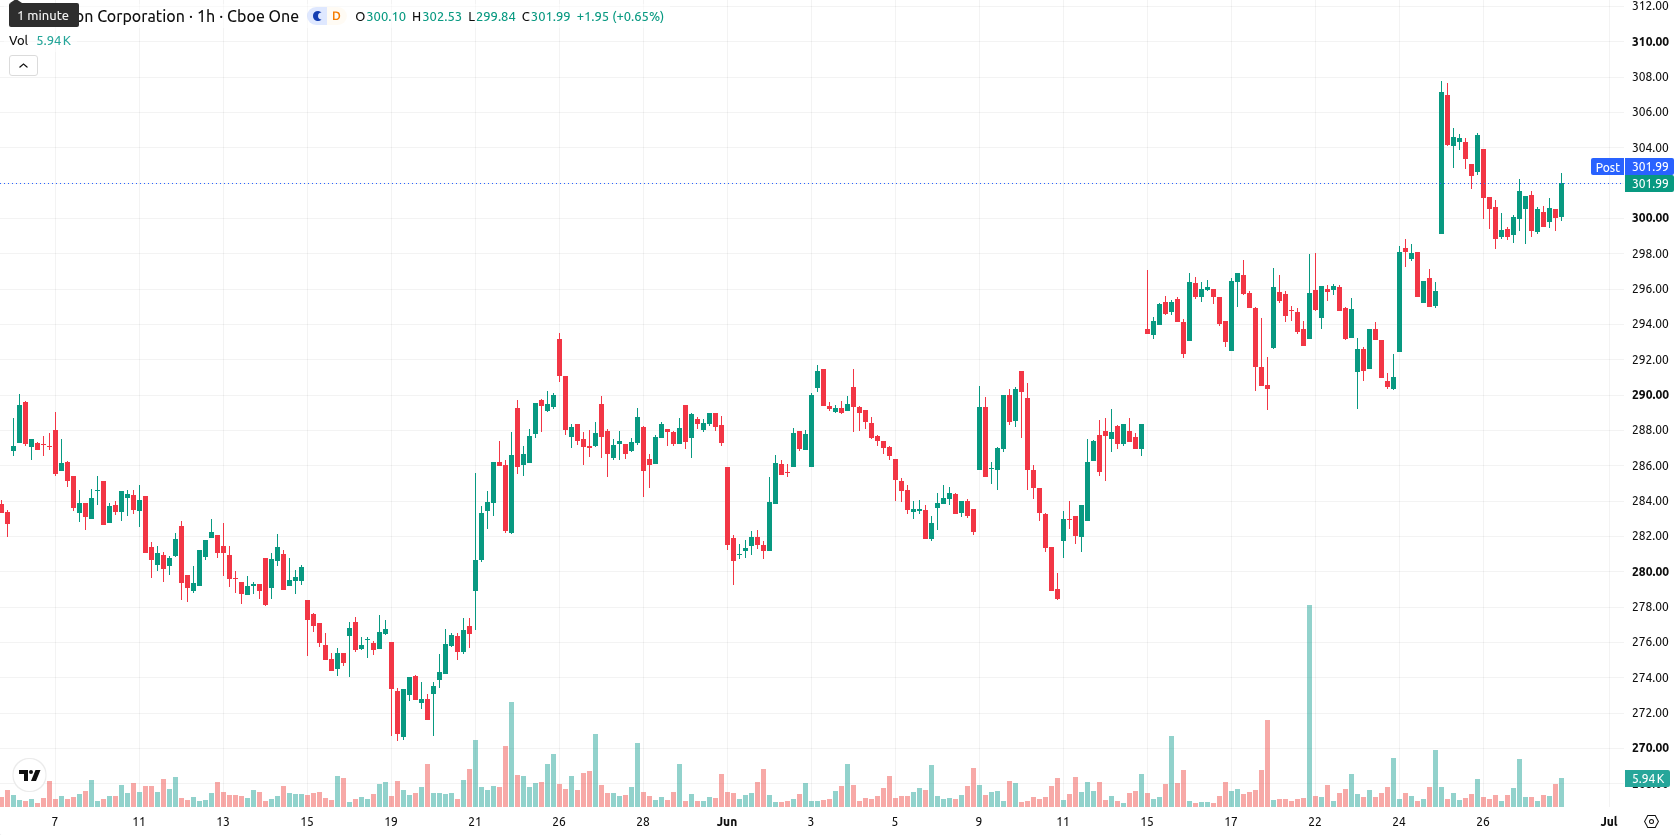
Sideways consolidation favored as volatility persists
For the coming sessions, price is likely to fluctuate within a $290.75 to $309.27 range, reflecting typical volatility for NDSN. Model probabilities modestly favor an upward move, estimated at 62%, but downside risk remains present. The expected scenario is sideways consolidation within this band, with a breakout above resistance necessary for a bullish outcome, and a breach below support opening the path to a bearish development.


-
 Afghanistan
-
 Albania
-
 Algeria
-
 Angola
-
 Argentina
-
 Armenia
-
 Australia
-
 Austria
-
 Azerbaijan
-
 Bahamas
-
 Bahrain
-
 Bangladesh
-
 Belarus
-
 Belgium
-
 Bolivia
-
 Botswana
-
 Brazil
-
 Brunei
-
 Bulgaria
-
 Cambodia
-
 Cameroon
-
 Canada
-
 Chile
Chile
-
 China
China
-
 Colombia
-
 Congo
Congo
-
 Costa Rica
-
 Cote d'Ivoire
-
 Croatia
-
 Cuba
Cuba
-
 Cyprus
-
 Czechia
-
 DR Congo
-
 Denmark
-
 Dominican Republic
-
 Ecuador
-
 Egypt
Egypt
-
 El Salvador
-
 Estonia
-
 Eswatini
-
 Ethiopia
-
 Finland
-
 France
-
 Georgia
-
 Germany
-
 Ghana
Ghana
-
 Greece
-
 Haiti
Haiti
-
 Hong Kong
-
 Hungary
-
 India
India
-
 Indonesia
-
 Iran, Islamic republic
-
 Iraq
Iraq
-
 Ireland
-
 Israel
-
 Italy
Italy
-
 Jamaica
-
 Japan
Japan
-
 Jordan
-
 Kazakhstan
-
 Kenya
Kenya
-
 Korea
Korea
-
 Kuwait
-
 Kyrgyzstan
-
 Laos
Laos
-
 Latvia
-
 Lebanon
-
 Lesotho
-
 Libya
Libya
-
 Lithuania
-
 Luxembourg
-
 Madagascar
-
 Malaysia
-
 Malta
Malta
-
 Mauritius
-
 Mexico
-
 Moldova
-
 Mongolia
-
 Montenegro
-
 Morocco
-
 Mozambique
-
 Myanmar
-
 Namibia
-
 Nepal
Nepal
-
 Netherlands
-
 New Zealand
-
 Nigeria
-
 North Macedonia
-
 Norway
-
 Oman
Oman
-
 Pakistan
-
 Palestine
-
 Panama
-
 Papua New Guinea
-
 Paraguay
-
 Peru
Peru
-
 Philippines
-
 Poland
-
 Portugal
-
 Puerto Rico
-
 Qatar
Qatar
-
 Reunion
-
 Romania
-
 Rwanda
-
 Saudi Arabia
-
 Serbia
-
 Singapore
-
 Slovakia
-
 Slovenia
-
 Somalia
-
 South Africa
-
 Spain
Spain
-
 Sri Lanka
-
 Sweden
-
 Switzerland
-
 Syria
Syria
-
 Taiwan
-
 Tajikistan
-
 Tanzania
-
 Thailand
-
 Trinidad and Tobago
-
 Tunisia
-
 Turkey
-
 UAE
UAE
-
 Uganda
-
 Ukraine
-
 United Kingdom
-
United States
-
 Uruguay
-
 Uzbekistan
-
 Venezuela
-
 Vietnam
-
 Yemen
Yemen
-
 Zambia
-
 Zimbabwe
- Forex
- Crypto
