
Qorvo stock consolidates as sellers remain in control of short-term trend

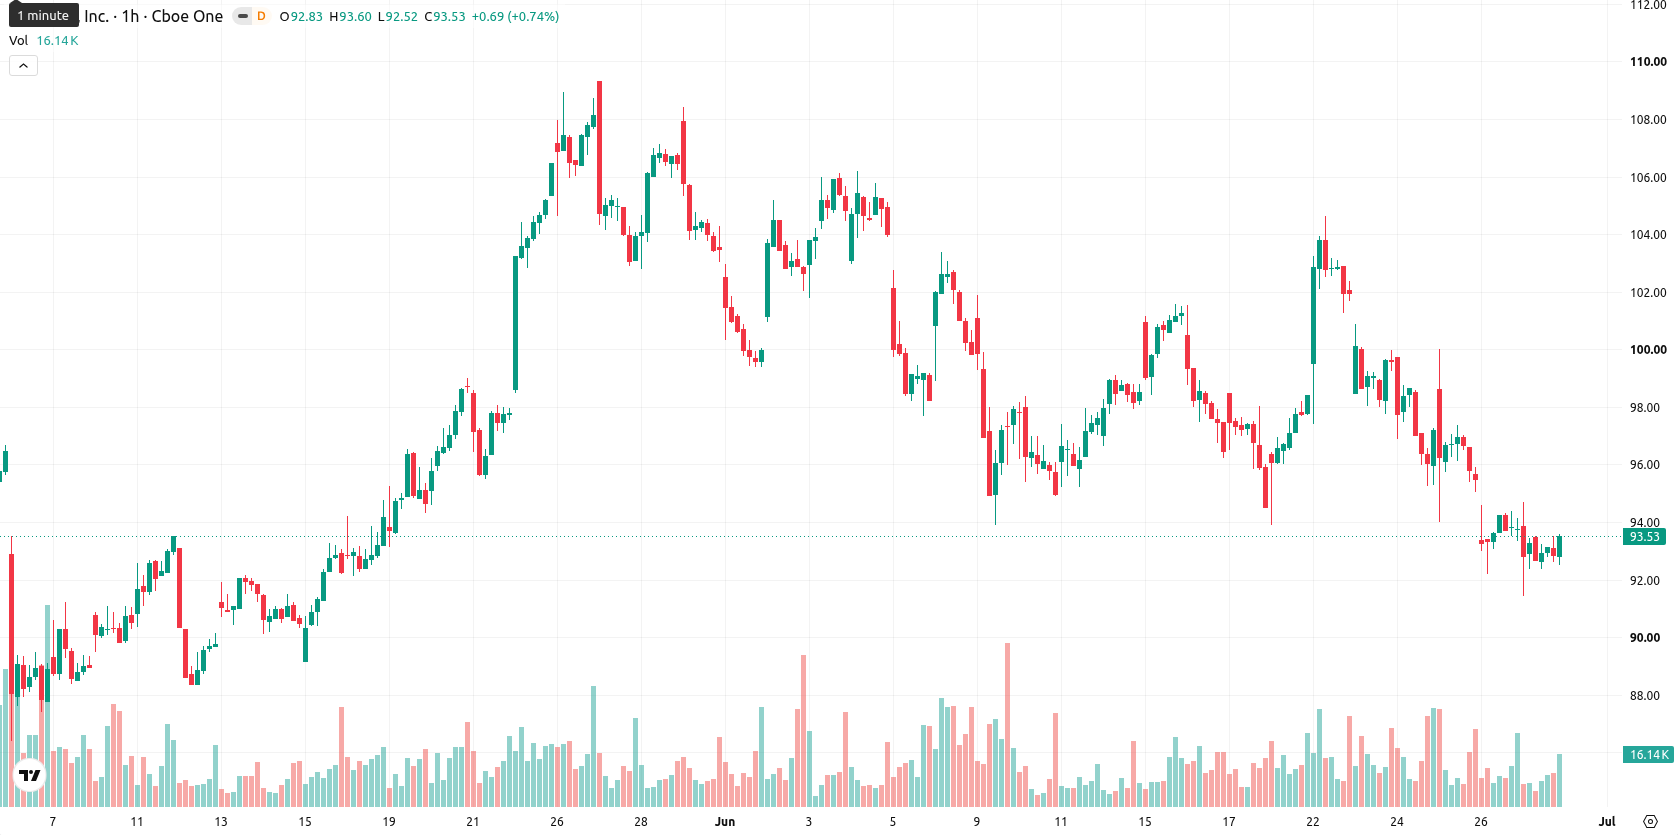
Qorvo (QRVO) stock is trading at $93.54 after a modest decline in the latest session, staying within a narrow intraday range. The price remains below its key moving averages, signaling sustained near-term weakness while trading above its longer-term trend levels.
Highlights
- Assenagon Asset Management S.A. raised its stake in Qorvo by 12.5% in Q1, signaling increased institutional interest.
- Expanded institutional ownership may influence retail sentiment by suggesting longer-term commitment from major shareholders.
- Qorvo faces ongoing short- and medium-term selling pressure, with a 62% probability of declining toward the $89.64–$97.44 range, unless resistance at $95.99 is decisively breached.
Institutional buildup drives longer-term sentiment and liquidity context
Assenagon Asset Management S.A. increased its holdings in Qorvo by 12.5% during the first quarter, according to MarketBeat. This move reflects expanded institutional ownership, which can influence retail sentiment by creating expectations of longer-term commitment and strategic positioning among major shareholders. While such transactions do not immediately translate to directional price moves, they add context to current liquidity and flow trends in the market.
Bearish technical picture as sellers dominate and momentum falters
On the hourly chart, QRVO is trading below the MA-20 at $94.23 and the MA-50 at $97.01, while remaining supported above the MA-200 at $87.37 on the daily timeframe. The Ichimoku Kijun line on the daily chart stands at $95.99 and acts as immediate resistance. Moving Average Convergence Divergence (MACD) indicates a strong sell signal, while Average Directional Index (ADX) reads neutral. The Relative Strength Index (RSI) sits at 42.06, showing mild selling pressure; Stochastic RSI is currently overbought, and Commodity Channel Index (CCI) submits a sell reading. Bull/Bear Power is oversold, suggesting sellers are dominating the intraday tone, while the Awesome Oscillator (AO) gives no clear signal, underscoring technical uncertainty.
Downside bias prevails amid range-bound consolidation outlook
Over the next few trading days, QRVO is expected to oscillate between $89.64 and $97.44, reflecting a typical volatility band relative to current levels. The likelihood of a downside move is higher at 62%, while an upward breakout scenario holds a 38% chance. Should the price remain between support at $89.64 and resistance at $95.99, further consolidation is likely; a move above $95.99 would point to renewed bullish momentum, while a drop below $89.64 would signal additional short-term weakness.
In a recent review, analysts observed that companies across various sectors are adapting their strategies to respond to evolving market forces and shifting competitive dynamics. The latest developments in Qorvo highlight continued institutional interest and technical uncertainty, suggesting that traders should closely monitor any decisive move outside the current $89.64–$97.44 volatility band for an early indication of directional momentum.


Latest Qorvo Inc News


-
 Afghanistan
-
 Albania
-
 Algeria
-
 Angola
-
 Argentina
-
 Armenia
-
 Australia
-
 Austria
-
 Azerbaijan
-
 Bahamas
-
 Bahrain
-
 Bangladesh
-
 Belarus
-
 Belgium
-
 Bolivia
-
 Botswana
-
 Brazil
-
 Brunei
-
 Bulgaria
-
 Cambodia
-
 Cameroon
-
 Canada
-
 Chile
Chile
-
 China
China
-
 Colombia
-
 Congo
Congo
-
 Costa Rica
-
 Cote d'Ivoire
-
 Croatia
-
 Cuba
Cuba
-
 Cyprus
-
 Czechia
-
 DR Congo
-
 Denmark
-
 Dominican Republic
-
 Ecuador
-
 Egypt
Egypt
-
 El Salvador
-
 Estonia
-
 Eswatini
-
 Ethiopia
-
 Finland
-
 France
-
 Georgia
-
 Germany
-
 Ghana
Ghana
-
 Greece
-
 Haiti
Haiti
-
 Hong Kong
-
 Hungary
-
 India
India
-
 Indonesia
-
 Iran, Islamic republic
-
 Iraq
Iraq
-
 Ireland
-
 Israel
-
 Italy
Italy
-
 Jamaica
-
 Japan
Japan
-
 Jordan
-
 Kazakhstan
-
 Kenya
Kenya
-
 Korea
Korea
-
 Kuwait
-
 Kyrgyzstan
-
 Laos
Laos
-
 Latvia
-
 Lebanon
-
 Lesotho
-
 Libya
Libya
-
 Lithuania
-
 Luxembourg
-
 Madagascar
-
 Malaysia
-
 Malta
Malta
-
 Mauritius
-
 Mexico
-
 Moldova
-
 Mongolia
-
 Montenegro
-
 Morocco
-
 Mozambique
-
 Myanmar
-
 Namibia
-
 Nepal
Nepal
-
 Netherlands
-
 New Zealand
-
 Nigeria
-
 North Macedonia
-
 Norway
-
 Oman
Oman
-
 Pakistan
-
 Palestine
-
 Panama
-
 Papua New Guinea
-
 Paraguay
-
 Peru
Peru
-
 Philippines
-
 Poland
-
 Portugal
-
 Puerto Rico
-
 Qatar
Qatar
-
 Reunion
-
 Romania
-
 Rwanda
-
 Saudi Arabia
-
 Serbia
-
 Singapore
-
 Slovakia
-
 Slovenia
-
 Somalia
-
 South Africa
-
 Spain
Spain
-
 Sri Lanka
-
 Sweden
-
 Switzerland
-
 Syria
Syria
-
 Taiwan
-
 Tajikistan
-
 Tanzania
-
 Thailand
-
 Trinidad and Tobago
-
 Tunisia
-
 Turkey
-
 UAE
UAE
-
 Uganda
-
 Ukraine
-
 United Kingdom
-
United States
-
 Uruguay
-
 Uzbekistan
-
 Venezuela
-
 Vietnam
-
 Yemen
Yemen
-
 Zambia
-
 Zimbabwe
- Forex
- Crypto
