
Rigetti Computing stock trades down amid intraday buying support despite overall softness

Rigetti Computing (RGTI) stock is trading at $19.24, marking a modest decline on the day. The price sits above its key short-term moving average but remains under medium- and long-term averages, highlighting the current balance between short-term buying interest and broader downward pressure.
Highlights
- RGTI/USD shows short-term bullish momentum but remains under medium- and long-term downside pressure.
- Momentum indicators are mixed, with weak trend signals and no clear overbought or oversold conditions emerging.
- Expected range for the next 2-3 days is $17.84 to $20.64, with 61% probability of further downside and key support at $18.76.
Mixed technical signals as momentum diverges from trend
On the hourly timeframe, RGTI is trading above the MA-20 at $18.93, but remains below the MA-50 at $19.83 and the MA-200 at $23.88. The Ichimoku Kijun provides immediate support at $18.76. Momentum indicators are mixed: the Moving Average Convergence Divergence (MACD) signals a strong sell, while the Average Directional Index (ADX) is neutral, suggesting a weak trend. The Relative Strength Index (RSI) stands at 48.68, indicating a mild sell bias but no overbought or oversold conditions; both Stochastic RSI and Commodity Channel Index (CCI) are neutral. Bull/Bear Power indicates buyer dominance intraday, and the Awesome Oscillator reflects a recent bullish tone. Despite today's 1.03% move lower and elevated volatility, technical signals indicate diverging intraday strength amid broader weakness.
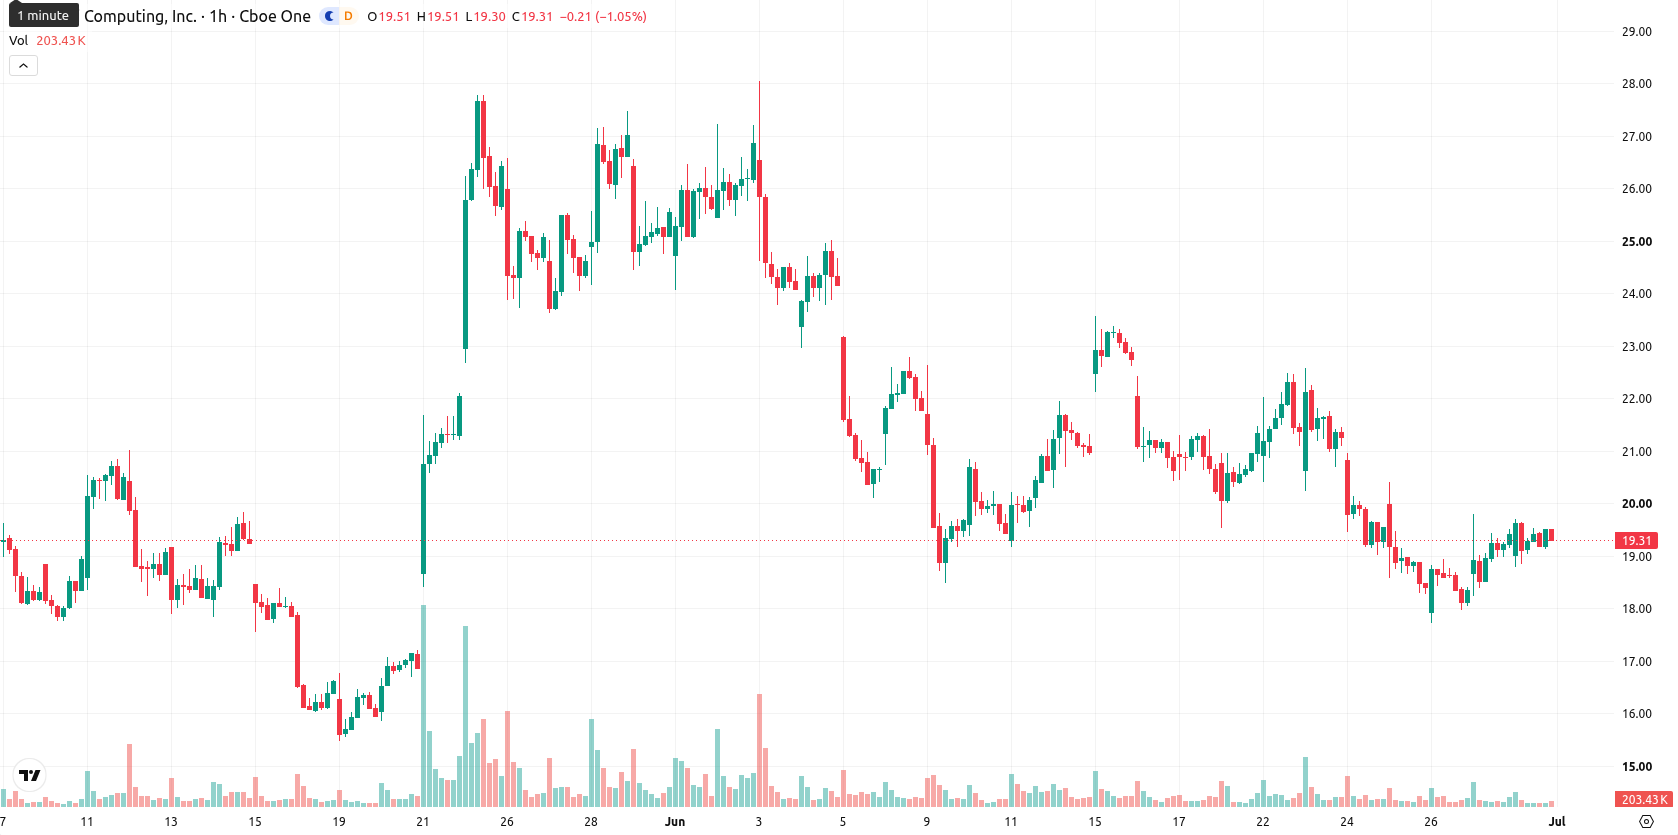
Directional risk tilts lower as near-term range holds
In the short term, RGTI is projected to trade within a $17.84 to $20.64 range over the next two to three sessions. There is a 39% probability of an upward move and a 61% chance of downward price action. The baseline scenario anticipates rangebound trading between noted support and resistance; a break above resistance would open the way to the upper part of the forecast range, while a breach of support would set up further downside within the expected volatility band.


-
 Afghanistan
-
 Albania
-
 Algeria
-
 Angola
-
 Argentina
-
 Armenia
-
 Australia
-
 Austria
-
 Azerbaijan
-
 Bahamas
-
 Bahrain
-
 Bangladesh
-
 Belarus
-
 Belgium
-
 Bolivia
-
 Botswana
-
 Brazil
-
 Brunei
-
 Bulgaria
-
 Cambodia
-
 Cameroon
-
 Canada
-
 Chile
Chile
-
 China
China
-
 Colombia
-
 Congo
Congo
-
 Costa Rica
-
 Cote d'Ivoire
-
 Croatia
-
 Cuba
Cuba
-
 Cyprus
-
 Czechia
-
 DR Congo
-
 Denmark
-
 Dominican Republic
-
 Ecuador
-
 Egypt
Egypt
-
 El Salvador
-
 Estonia
-
 Eswatini
-
 Ethiopia
-
 Finland
-
 France
-
 Georgia
-
 Germany
-
 Ghana
Ghana
-
 Greece
-
 Haiti
Haiti
-
 Hong Kong
-
 Hungary
-
 India
India
-
 Indonesia
-
 Iran, Islamic republic
-
 Iraq
Iraq
-
 Ireland
-
 Israel
-
 Italy
Italy
-
 Jamaica
-
 Japan
Japan
-
 Jordan
-
 Kazakhstan
-
 Kenya
Kenya
-
 Korea
Korea
-
 Kuwait
-
 Kyrgyzstan
-
 Laos
Laos
-
 Latvia
-
 Lebanon
-
 Lesotho
-
 Libya
Libya
-
 Lithuania
-
 Luxembourg
-
 Madagascar
-
 Malaysia
-
 Malta
Malta
-
 Mauritius
-
 Mexico
-
 Moldova
-
 Mongolia
-
 Montenegro
-
 Morocco
-
 Mozambique
-
 Myanmar
-
 Namibia
-
 Nepal
Nepal
-
 Netherlands
-
 New Zealand
-
 Nigeria
-
 North Macedonia
-
 Norway
-
 Oman
Oman
-
 Pakistan
-
 Palestine
-
 Panama
-
 Papua New Guinea
-
 Paraguay
-
 Peru
Peru
-
 Philippines
-
 Poland
-
 Portugal
-
 Puerto Rico
-
 Qatar
Qatar
-
 Reunion
-
 Romania
-
 Rwanda
-
 Saudi Arabia
-
 Serbia
-
 Singapore
-
 Slovakia
-
 Slovenia
-
 Somalia
-
 South Africa
-
 Spain
Spain
-
 Sri Lanka
-
 Sweden
-
 Switzerland
-
 Syria
Syria
-
 Taiwan
-
 Tajikistan
-
 Tanzania
-
 Thailand
-
 Trinidad and Tobago
-
 Tunisia
-
 Turkey
-
 UAE
UAE
-
 Uganda
-
 Ukraine
-
 United Kingdom
-
United States
-
 Uruguay
-
 Uzbekistan
-
 Venezuela
-
 Vietnam
-
 Yemen
Yemen
-
 Zambia
-
 Zimbabwe
- Forex
- Crypto
