
Trip.com Group stock holds steady as price tests $36.03 support

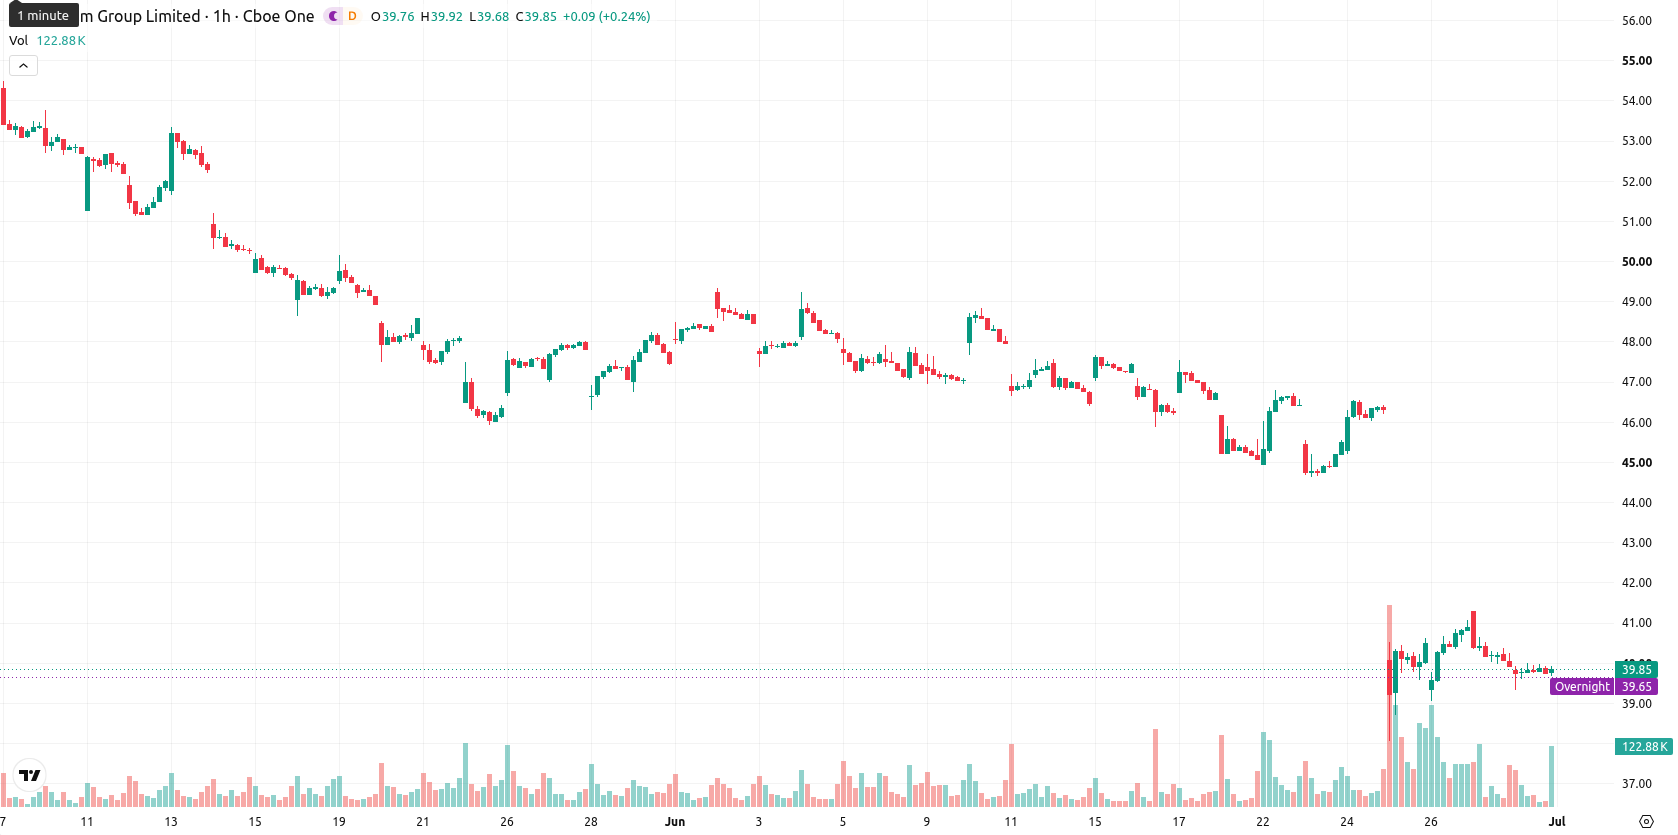
Trip.com Group (TCOM) stock is trading at $39.84, with a slight move lower on the day. The price remains beneath its key moving averages, reflecting ongoing pressure from recent sessions.
Highlights
- TCOM/USD trades under major moving averages, signaling persistent downside momentum across short, medium, and long timeframes.
- Technical indicators show strong selling pressure, with momentum negative and limited bullish conviction despite short-term rebound signals.
- Trading is expected in a $36.03 to $43.65 range with a 77% probability of further downside unless $40.14 resistance is reclaimed.
Bearish momentum persists amid clustered resistance and weak indicators
On the H1 timeframe, TCOM is trading below the 20-period moving average at $40.18 and the 50-period moving average at $42.63, and it also remains well under the long-term 200-period moving average at $61.16 on the daily chart. The Ichimoku Kijun sits at $40.14, serving as immediate resistance, while key technical support is observed near $36.03 and next resistance is seen at $43.65. Both the Moving Average Convergence Divergence (MACD) and the Average Directional Index (ADX) are in strong sell territory, confirming negative momentum. The Relative Strength Index (RSI) is at 34.42 and the Commodity Channel Index (CCI) also suggest continued selling pressure. The Stochastic RSI signals a possible short-term rebound due to a divergence, though the Awesome Oscillator does not confirm the prevailing trend. Bull/Bear Power points to dominating sellers at current levels.
Downside risk dominates as sideways consolidation likely without catalyst
Looking ahead to the next several sessions, TCOM is likely to trade in a range between $36.03 and $43.65—a typical volatility corridor relative to the current price. There is a 23% probability of an upward move should the price break out above the $40.14 resistance, but the downside scenario, with a move below $36.03, remains more probable at 77%. The base case scenario sees the stock consolidating sideways within this band unless a catalyst triggers a breakout.


Latest Trip.com Group Ltd. Sponsored ADR News


-
 Afghanistan
-
 Albania
-
 Algeria
-
 Angola
-
 Argentina
-
 Armenia
-
 Australia
-
 Austria
-
 Azerbaijan
-
 Bahamas
-
 Bahrain
-
 Bangladesh
-
 Belarus
-
 Belgium
-
 Bolivia
-
 Botswana
-
 Brazil
-
 Brunei
-
 Bulgaria
-
 Cambodia
-
 Cameroon
-
 Canada
-
 Chile
Chile
-
 China
China
-
 Colombia
-
 Congo
Congo
-
 Costa Rica
-
 Cote d'Ivoire
-
 Croatia
-
 Cuba
Cuba
-
 Cyprus
-
 Czechia
-
 DR Congo
-
 Denmark
-
 Dominican Republic
-
 Ecuador
-
 Egypt
Egypt
-
 El Salvador
-
 Estonia
-
 Eswatini
-
 Ethiopia
-
 Finland
-
 France
-
 Georgia
-
 Germany
-
 Ghana
Ghana
-
 Greece
-
 Haiti
Haiti
-
 Hong Kong
-
 Hungary
-
 India
India
-
 Indonesia
-
 Iran, Islamic republic
-
 Iraq
Iraq
-
 Ireland
-
 Israel
-
 Italy
Italy
-
 Jamaica
-
 Japan
Japan
-
 Jordan
-
 Kazakhstan
-
 Kenya
Kenya
-
 Korea
Korea
-
 Kuwait
-
 Kyrgyzstan
-
 Laos
Laos
-
 Latvia
-
 Lebanon
-
 Lesotho
-
 Libya
Libya
-
 Lithuania
-
 Luxembourg
-
 Madagascar
-
 Malaysia
-
 Malta
Malta
-
 Mauritius
-
 Mexico
-
 Moldova
-
 Mongolia
-
 Montenegro
-
 Morocco
-
 Mozambique
-
 Myanmar
-
 Namibia
-
 Nepal
Nepal
-
 Netherlands
-
 New Zealand
-
 Nigeria
-
 North Macedonia
-
 Norway
-
 Oman
Oman
-
 Pakistan
-
 Palestine
-
 Panama
-
 Papua New Guinea
-
 Paraguay
-
 Peru
Peru
-
 Philippines
-
 Poland
-
 Portugal
-
 Puerto Rico
-
 Qatar
Qatar
-
 Reunion
-
 Romania
-
 Rwanda
-
 Saudi Arabia
-
 Serbia
-
 Singapore
-
 Slovakia
-
 Slovenia
-
 Somalia
-
 South Africa
-
 Spain
Spain
-
 Sri Lanka
-
 Sweden
-
 Switzerland
-
 Syria
Syria
-
 Taiwan
-
 Tajikistan
-
 Tanzania
-
 Thailand
-
 Trinidad and Tobago
-
 Tunisia
-
 Turkey
-
 UAE
UAE
-
 Uganda
-
 Ukraine
-
 United Kingdom
-
United States
-
 Uruguay
-
 Uzbekistan
-
 Venezuela
-
 Vietnam
-
 Yemen
Yemen
-
 Zambia
-
 Zimbabwe
- Forex
- Crypto
