
PepsiCo stock drops nearly 5% after inflationary pressure reduces regional demand

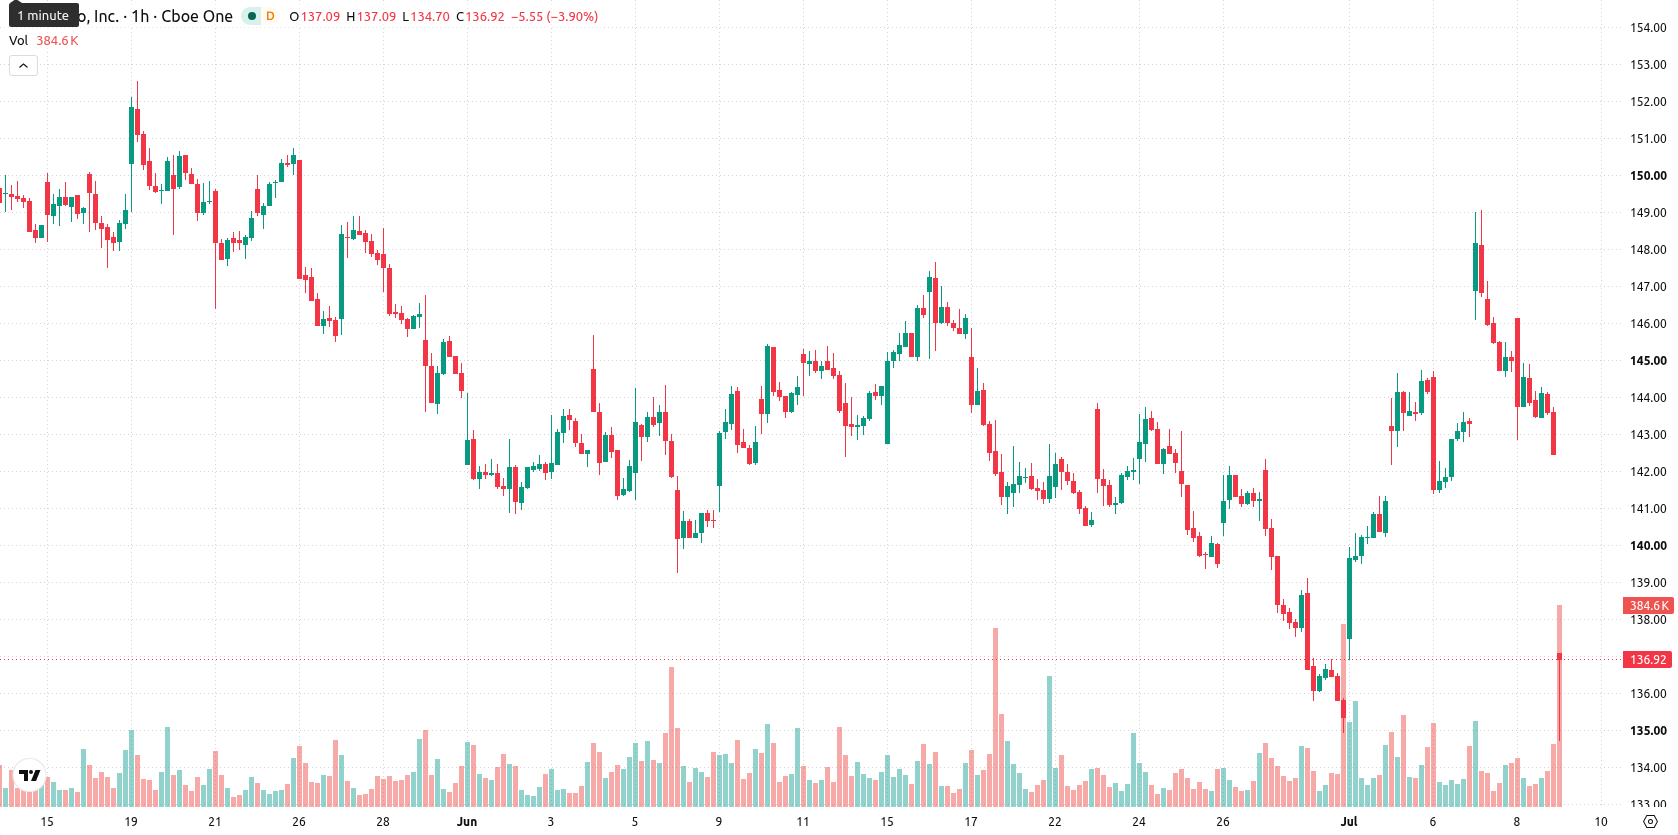
PepsiCo (PEP) stock is trading at $135.91 after declining 4.63% on the day, closing near session lows. The price is currently positioned underneath its key moving averages across short, medium, and long-term timeframes.
 138.73
149.04
138.73
149.04
Highlights
- PepsiCo's Q2 net sales rose 6.4% to $24.18 billion, driven primarily by robust international demand.
- Adjusted EPS marginally missed consensus at $2.20, with North American revenue pressured by weakened consumer spending and inflation.
- Technicals indicate continued selling pressure, with PEP/USD expected to consolidate between $132.48 and $142.57 and a bearish bias prevailing.
Sales growth offset by earnings miss and regional weakness
PepsiCo released its second-quarter 2026 results, recording net sales of $24.18 billion—a 6.4% increase year-over-year—driven chiefly by strong international demand, according to CNBC. This top-line growth was accompanied by a marginal miss on adjusted earnings per share, which came in at $2.20 versus a consensus estimate of $2.21, tempering some of the bullish impact from sales outperformance. North American food and beverage revenues declined, attributed to tightening consumer budgets and persistent inflation, highlighting ongoing regional headwinds as management reaffirmed its full-year guidance.
Oversold momentum as technical barriers reinforce seller control
On the hourly chart, PEP trades below the MA-20 at $143.87 and the MA-50 at $141.48, with long-term positioning also below the MA-200 at $150.11 on the daily timeframe. The Ichimoku Kijun at $141.95 now forms immediate resistance. Among momentum indicators, the Moving Average Convergence Divergence (MACD) remains neutral, while the Average Directional Index (ADX) signals a prevailing sell bias. The Relative Strength Index (RSI) is at 27.45, alongside Stochastic RSI, Commodity Channel Index (CCI), and Bull/Bear Power—all of which are in oversold territory, reinforcing intraday seller dominance. The Awesome Oscillator also signals strong selling momentum, and there are no bullish divergences across short-term oscillators or momentum indicators.
Downside favored as rebound likelihood remains low near support
In the next 2–3 trading days, PEP is forecast to fluctuate within the $132.48 to $142.57 range, reflecting typical volatility. The probability of a rebound is limited to 22%, while a continued decline holds a 78% likelihood. The most likely scenario is consolidation within these bounds with resistance at the $141.95 Kijun level. Upside potential would be considered only if a breakout above this resistance is achieved, while a decisive move below the $132.48 support could accelerate further downside.
Earlier, analysts noted that PepsiCo shares displayed constructive technical momentum ahead of the second-quarter earnings release, with expectations for continued gains hinging on supportive market conditions. However, following the actual results and a decisive technical breakdown, immediate focus shifts to whether buyer exhaustion will persist or if stabilization emerges near key oversold levels, making price action around the $132.48 support a critical indicator for the next directional move.








-
 Afghanistan
-
 Albania
-
 Algeria
-
 Angola
-
 Argentina
-
 Armenia
-
 Australia
-
 Austria
-
 Azerbaijan
-
 Bahamas
-
 Bahrain
-
 Bangladesh
-
 Belarus
-
 Belgium
-
 Bolivia
-
 Botswana
-
 Brazil
-
 Brunei
-
 Bulgaria
-
 Cambodia
-
 Cameroon
-
 Canada
-
 Chile
Chile
-
 China
China
-
 Colombia
-
 Congo
Congo
-
 Costa Rica
-
 Cote d'Ivoire
-
 Croatia
-
 Cuba
Cuba
-
 Cyprus
-
 Czechia
-
 DR Congo
-
 Denmark
-
 Dominican Republic
-
 Ecuador
-
 Egypt
Egypt
-
 El Salvador
-
 Estonia
-
 Eswatini
-
 Ethiopia
-
 Finland
-
 France
-
 Georgia
-
 Germany
-
 Ghana
Ghana
-
 Greece
-
 Haiti
Haiti
-
 Hong Kong
-
 Hungary
-
 India
India
-
 Indonesia
-
 Iran, Islamic republic
-
 Iraq
Iraq
-
 Ireland
-
 Israel
-
 Italy
Italy
-
 Jamaica
-
 Japan
Japan
-
 Jordan
-
 Kazakhstan
-
 Kenya
Kenya
-
 Korea
Korea
-
 Kuwait
-
 Kyrgyzstan
-
 Laos
Laos
-
 Latvia
-
 Lebanon
-
 Lesotho
-
 Libya
Libya
-
 Lithuania
-
 Luxembourg
-
 Madagascar
-
 Malaysia
-
 Malta
Malta
-
 Mauritius
-
 Mexico
-
 Moldova
-
 Mongolia
-
 Montenegro
-
 Morocco
-
 Mozambique
-
 Myanmar
-
 Namibia
-
 Nepal
Nepal
-
 Netherlands
-
 New Zealand
-
 Nigeria
-
 North Macedonia
-
 Norway
-
 Oman
Oman
-
 Pakistan
-
 Palestine
-
 Panama
-
 Papua New Guinea
-
 Paraguay
-
 Peru
Peru
-
 Philippines
-
 Poland
-
 Portugal
-
 Puerto Rico
-
 Qatar
Qatar
-
 Reunion
-
 Romania
-
 Rwanda
-
 Saudi Arabia
-
 Serbia
-
 Singapore
-
 Slovakia
-
 Slovenia
-
 Somalia
-
 South Africa
-
 Spain
Spain
-
 Sri Lanka
-
 Sweden
-
 Switzerland
-
 Syria
Syria
-
 Taiwan
-
 Tajikistan
-
 Tanzania
-
 Thailand
-
 Trinidad and Tobago
-
 Tunisia
-
 Turkey
-
 UAE
UAE
-
 Uganda
-
 Ukraine
-
 United Kingdom
-
United States
-
 Uruguay
-
 Uzbekistan
-
 Venezuela
-
 Vietnam
-
 Yemen
Yemen
-
 Zambia
-
 Zimbabwe
- Forex
- Crypto











