
What's behind Nvidia's latest 1.9% stock pullback?

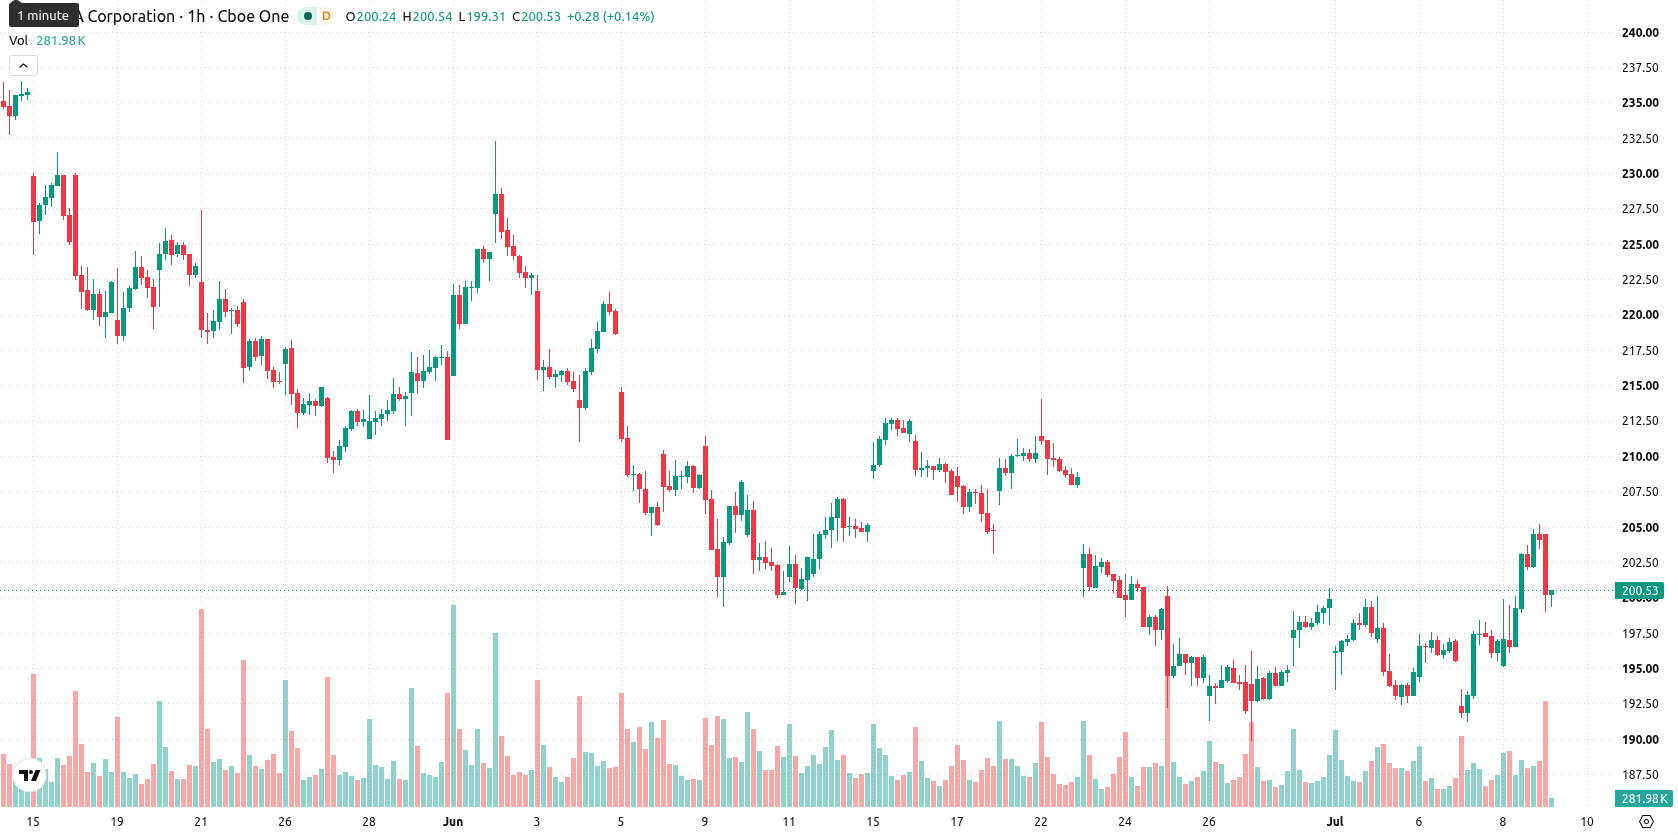
Nvidia (NVDA) stock is trading at $199.55, reflecting a daily decline of 1.94%. The price currently sits above its key moving averages, indicating resilience despite the session’s volatility.
 204.58
205.16
204.58
205.16
Highlights
- China is allowing select tech firms like Alibaba and ByteDance to buy Nvidia's H200 AI chips under new regulatory terms, reopening a key revenue stream.
- Nvidia's forward P/E has declined to 22.22x, near the S&P 500 average, while the company reaffirms returning 50% of cash flow to shareholders and may increase buybacks.
- Technicals show ongoing bullish momentum with most indicators overbought; expected price range is $193.30 to $210.47 over the next 2–3 sessions, with risks of short-term pullbacks.
China chip access and valuation shift as buyback plans expand
Regulatory developments in China are set to enable select technology firms, including Alibaba and ByteDance, to purchase Nvidia's H200 artificial intelligence chips under new conditions, reviving Nvidia's access to a key market after earlier constraints, according to Gurufocus. Separately, Finance Yahoo reported that Nvidia's forward price-to-earnings ratio has fallen to 22.22x, its lowest since 2019 and approaching the S&P 500 average, making the stock appear comparatively attractive from a valuation standpoint. Nvidia has also reaffirmed its plan to return 50% of its cash flow to shareholders for the year and may accelerate share buybacks, following the recent enhancement of its capital return program and dividend increase, as noted by Finance Yahoo — though price action has remained under broader selling pressure.
Upward momentum in play as technical gauges flag buyer dominance
On the technical side, NVDA is trading above its MA-20 at $197.66 and MA-50 at $196.81 on the hourly chart, as well as above the MA-200 at $191.4 on the daily timeframe. The Ichimoku Kijun currently sits at $198.13, now acting as immediate support. The Moving Average Convergence Divergence (MACD) signals a buy, while the Average Directional Index (ADX) remains neutral, suggesting momentum is solid but not accelerating. The Relative Strength Index (RSI) stands at 65.46, also supporting a buy signal, while the Stochastic RSI, Commodity Channel Index (CCI), and Bull/Bear Power all indicate overbought conditions, underlining persistent buyer dominance intraday. The Awesome Oscillator supports the prevailing upward trend, though stretched oscillator levels hint at potential for near-term pullbacks due to an opening gap and elevated volatility.
Upside odds favor gains as volatility shapes trading band
Looking ahead to the next two to three sessions, NVDA is expected to trade within a range of $193.30 to $210.47, consistent with its typical volatility band relative to current levels. The probability skews toward further gains with a 68% chance of an upside move versus 32% likelihood of a decline. The most likely scenario is continued sideways trading. A sustained break above the upper bound would open up a bullish path, whereas a drop below immediate support at $198.13 may trigger a deeper short-term retracement.
Earlier, analysts noted that Nvidia maintained a positive long-term trend despite volatility and mixed technical signals within the semiconductor sector. With fresh regulatory developments restoring access to key markets and an improved valuation profile, traders should watch for a sustained move above the $210.47 level as confirmation of renewed bullish momentum.



Latest NVDA News






-
 Afghanistan
-
 Albania
-
 Algeria
-
 Angola
-
 Argentina
-
 Armenia
-
 Australia
-
 Austria
-
 Azerbaijan
-
 Bahamas
-
 Bahrain
-
 Bangladesh
-
 Belarus
-
 Belgium
-
 Bolivia
-
 Botswana
-
 Brazil
-
 Brunei
-
 Bulgaria
-
 Cambodia
-
 Cameroon
-
 Canada
-
 Chile
Chile
-
 China
China
-
 Colombia
-
 Congo
Congo
-
 Costa Rica
-
 Cote d'Ivoire
-
 Croatia
-
 Cuba
Cuba
-
 Cyprus
-
 Czechia
-
 DR Congo
-
 Denmark
-
 Dominican Republic
-
 Ecuador
-
 Egypt
Egypt
-
 El Salvador
-
 Estonia
-
 Eswatini
-
 Ethiopia
-
 Finland
-
 France
-
 Georgia
-
 Germany
-
 Ghana
Ghana
-
 Greece
-
 Haiti
Haiti
-
 Hong Kong
-
 Hungary
-
 India
India
-
 Indonesia
-
 Iran, Islamic republic
-
 Iraq
Iraq
-
 Ireland
-
 Israel
-
 Italy
Italy
-
 Jamaica
-
 Japan
Japan
-
 Jordan
-
 Kazakhstan
-
 Kenya
Kenya
-
 Korea
Korea
-
 Kuwait
-
 Kyrgyzstan
-
 Laos
Laos
-
 Latvia
-
 Lebanon
-
 Lesotho
-
 Libya
Libya
-
 Lithuania
-
 Luxembourg
-
 Madagascar
-
 Malaysia
-
 Malta
Malta
-
 Mauritius
-
 Mexico
-
 Moldova
-
 Mongolia
-
 Montenegro
-
 Morocco
-
 Mozambique
-
 Myanmar
-
 Namibia
-
 Nepal
Nepal
-
 Netherlands
-
 New Zealand
-
 Nigeria
-
 North Macedonia
-
 Norway
-
 Oman
Oman
-
 Pakistan
-
 Palestine
-
 Panama
-
 Papua New Guinea
-
 Paraguay
-
 Peru
Peru
-
 Philippines
-
 Poland
-
 Portugal
-
 Puerto Rico
-
 Qatar
Qatar
-
 Reunion
-
 Romania
-
 Rwanda
-
 Saudi Arabia
-
 Serbia
-
 Singapore
-
 Slovakia
-
 Slovenia
-
 Somalia
-
 South Africa
-
 Spain
Spain
-
 Sri Lanka
-
 Sweden
-
 Switzerland
-
 Syria
Syria
-
 Taiwan
-
 Tajikistan
-
 Tanzania
-
 Thailand
-
 Trinidad and Tobago
-
 Tunisia
-
 Turkey
-
 UAE
UAE
-
 Uganda
-
 Ukraine
-
 United Kingdom
-
United States
-
 Uruguay
-
 Uzbekistan
-
 Venezuela
-
 Vietnam
-
 Yemen
Yemen
-
 Zambia
-
 Zimbabwe
- Forex
- Crypto











