

JetBlue Airways (JBLU) stock is trading at $5.92, up 6.09% on the day. The price is positioned above its key moving averages, reflecting underlying strength in both recent and longer-term trends.
 5.99
6.27
5.99
6.27
Highlights
- JetBlue's aggressive South Florida expansion aims to capture market share vacated by Spirit Airlines' exit, directly boosting revenue prospects.
- Industry-wide cost pressures from higher oil prices could limit profit margin expansion despite JetBlue's strategic positioning gains.
- JBLU's price action is bullish, trading near $5.92, with a projected 2–3 day range of $5.53–$6.31 and 74% probability of an upward move, though momentum signals remain mixed.
Revenue momentum as JetBlue targets Spirit's lost demand despite cost risk
JetBlue Airways has initiated a major investment and expansion in South Florida aimed at capturing increased travel demand left in the wake of Spirit Airlines' shutdown, according to Nbcmiami. By targeting new routes and reallocating resources, JetBlue can immediately absorb a portion of Spirit's former customer base—providing a direct catalyst for revenue growth. While recent shipping attacks in the Middle East have driven oil prices higher, thereby elevating operating costs for airlines and potentially limiting profit margin expansion, these sector-wide headwinds are being countered by JetBlue's proactive push to secure a stronger competitive position.
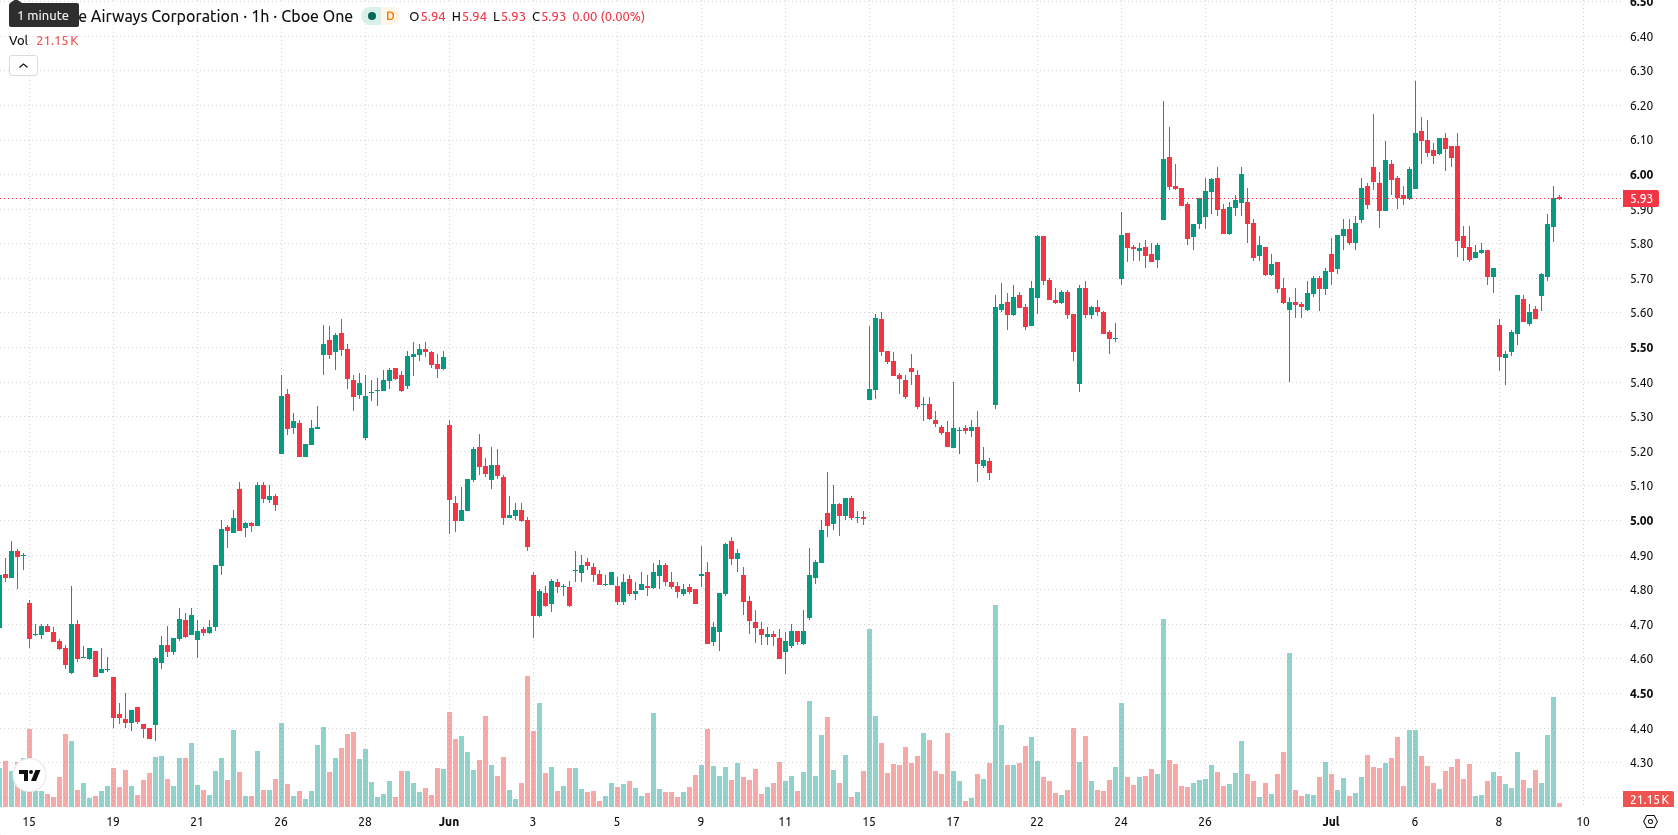
Mixed momentum as technical support holds and indicators diverge
JBLU is trading above the 20-period ($5.75) and 50-period ($5.8) moving averages on the hourly chart, while well above the 200-period ($4.93) moving average on the daily chart. The Ichimoku Kijun is at $5.83, marking immediate support. On the indicator side, the Moving Average Convergence Divergence (MACD) signals a strong sell, the Average Directional Index (ADX) is neutral, and the Commodity Channel Index (CCI) is neutral as well, reflecting unclear overall trend strength. The Relative Strength Index (RSI) stands at 53.99, indicating a mild bullish momentum, but the Stochastic RSI is overbought, suggesting short-term price stretch. Bull/Bear Power indicates buyers are currently dominant, and the Awesome Oscillator is neutral. Price action neared the daily high with sustained volatility, with a 0.06 gap formed into the session.
Sideways bias as range-bound volatility limits directional risk
Over the next 2 to 3 trading days, JBLU is expected to move within a $5.53 to $6.31 volatility band relative to current levels. The baseline scenario suggests the price will fluctuate sideways inside this projected range. If bullish momentum prevails, a breakout above $6.31 is possible, while a slip below $5.53 would signal renewed downside risk. The probability of an upward move stands at 74%, while the likelihood of a downside break is much lower.
Earlier, analysts noted that JetBlue faced persistent bearish momentum and heightened uncertainty amid legal and operational challenges. The current shift to a bullish technical position, supported by strategic expansion in South Florida, signals improved investor sentiment, making a breakout above $6.31 a key level to watch for continued upside.



Latest JetBlue News





-
 Afghanistan
-
 Albania
-
 Algeria
-
 Angola
-
 Argentina
-
 Armenia
-
 Australia
-
 Austria
-
 Azerbaijan
-
 Bahamas
-
 Bahrain
-
 Bangladesh
-
 Belarus
-
 Belgium
-
 Bolivia
-
 Botswana
-
 Brazil
-
 Brunei
-
 Bulgaria
-
 Cambodia
-
 Cameroon
-
 Canada
-
 Chile
Chile
-
 China
China
-
 Colombia
-
 Congo
Congo
-
 Costa Rica
-
 Cote d'Ivoire
-
 Croatia
-
 Cuba
Cuba
-
 Cyprus
-
 Czechia
-
 DR Congo
-
 Denmark
-
 Dominican Republic
-
 Ecuador
-
 Egypt
Egypt
-
 El Salvador
-
 Estonia
-
 Eswatini
-
 Ethiopia
-
 Finland
-
 France
-
 Georgia
-
 Germany
-
 Ghana
Ghana
-
 Greece
-
 Haiti
Haiti
-
 Hong Kong
-
 Hungary
-
 India
India
-
 Indonesia
-
 Iran, Islamic republic
-
 Iraq
Iraq
-
 Ireland
-
 Israel
-
 Italy
Italy
-
 Jamaica
-
 Japan
Japan
-
 Jordan
-
 Kazakhstan
-
 Kenya
Kenya
-
 Korea
Korea
-
 Kuwait
-
 Kyrgyzstan
-
 Laos
Laos
-
 Latvia
-
 Lebanon
-
 Lesotho
-
 Libya
Libya
-
 Lithuania
-
 Luxembourg
-
 Madagascar
-
 Malaysia
-
 Malta
Malta
-
 Mauritius
-
 Mexico
-
 Moldova
-
 Mongolia
-
 Montenegro
-
 Morocco
-
 Mozambique
-
 Myanmar
-
 Namibia
-
 Nepal
Nepal
-
 Netherlands
-
 New Zealand
-
 Nigeria
-
 North Macedonia
-
 Norway
-
 Oman
Oman
-
 Pakistan
-
 Palestine
-
 Panama
-
 Papua New Guinea
-
 Paraguay
-
 Peru
Peru
-
 Philippines
-
 Poland
-
 Portugal
-
 Puerto Rico
-
 Qatar
Qatar
-
 Reunion
-
 Romania
-
 Rwanda
-
 Saudi Arabia
-
 Serbia
-
 Singapore
-
 Slovakia
-
 Slovenia
-
 Somalia
-
 South Africa
-
 Spain
Spain
-
 Sri Lanka
-
 Sweden
-
 Switzerland
-
 Syria
Syria
-
 Taiwan
-
 Tajikistan
-
 Tanzania
-
 Thailand
-
 Trinidad and Tobago
-
 Tunisia
-
 Turkey
-
 UAE
UAE
-
 Uganda
-
 Ukraine
-
 United Kingdom
-
United States
-
 Uruguay
-
 Uzbekistan
-
 Venezuela
-
 Vietnam
-
 Yemen
Yemen
-
 Zambia
-
 Zimbabwe
- Forex
- Crypto











