
Costco stock drops under $938 resistance as seller control dominates charts: weekly outlook

Costco Wholesale Corporation (COST) is currently trading at $911.91, which is notably below both its weekly 20-period Moving Average ($988.59) and 50-period Moving Average ($956.79), but remains significantly above the longer-term 200-period Moving Average ($778.84). Over the past week, Costco declined by $39.79 (4.18%), closing at the bottom of the weekly range and further extending its move under medium-term resistance levels.
 914.75
969.00
914.75
969.00
Highlights
- Costco trades well below key short- and medium-term moving averages, signalling pronounced medium-term bearish momentum.
- Oscillators indicate clear oversold conditions, with sellers dominant and technical signals pointing to continued downside pressure.
- Expected trading range is $905–$938, with high probability of further declines unless support stabilizes; upside breakout is unlikely short-term.
Strong sales offset by regional and legal headwinds during the week
Costco released its June sales figures, reporting a 10.6% year-over-year increase in net sales to approximately $29.2 billion, with U.S. comparable sales also rising by the same percentage. Despite the strong revenue growth, uneven regional results—particularly weaker performance in Canada and currency headwinds—drew investor attention. Costco declared a regular quarterly dividend of $1.47 per share and initiated a digital wallet feature in its mobile app for enhanced in-store payment options. Additionally, the company faces a class action lawsuit alleging elevated heavy metal content in certain protein powders sold in its stores.
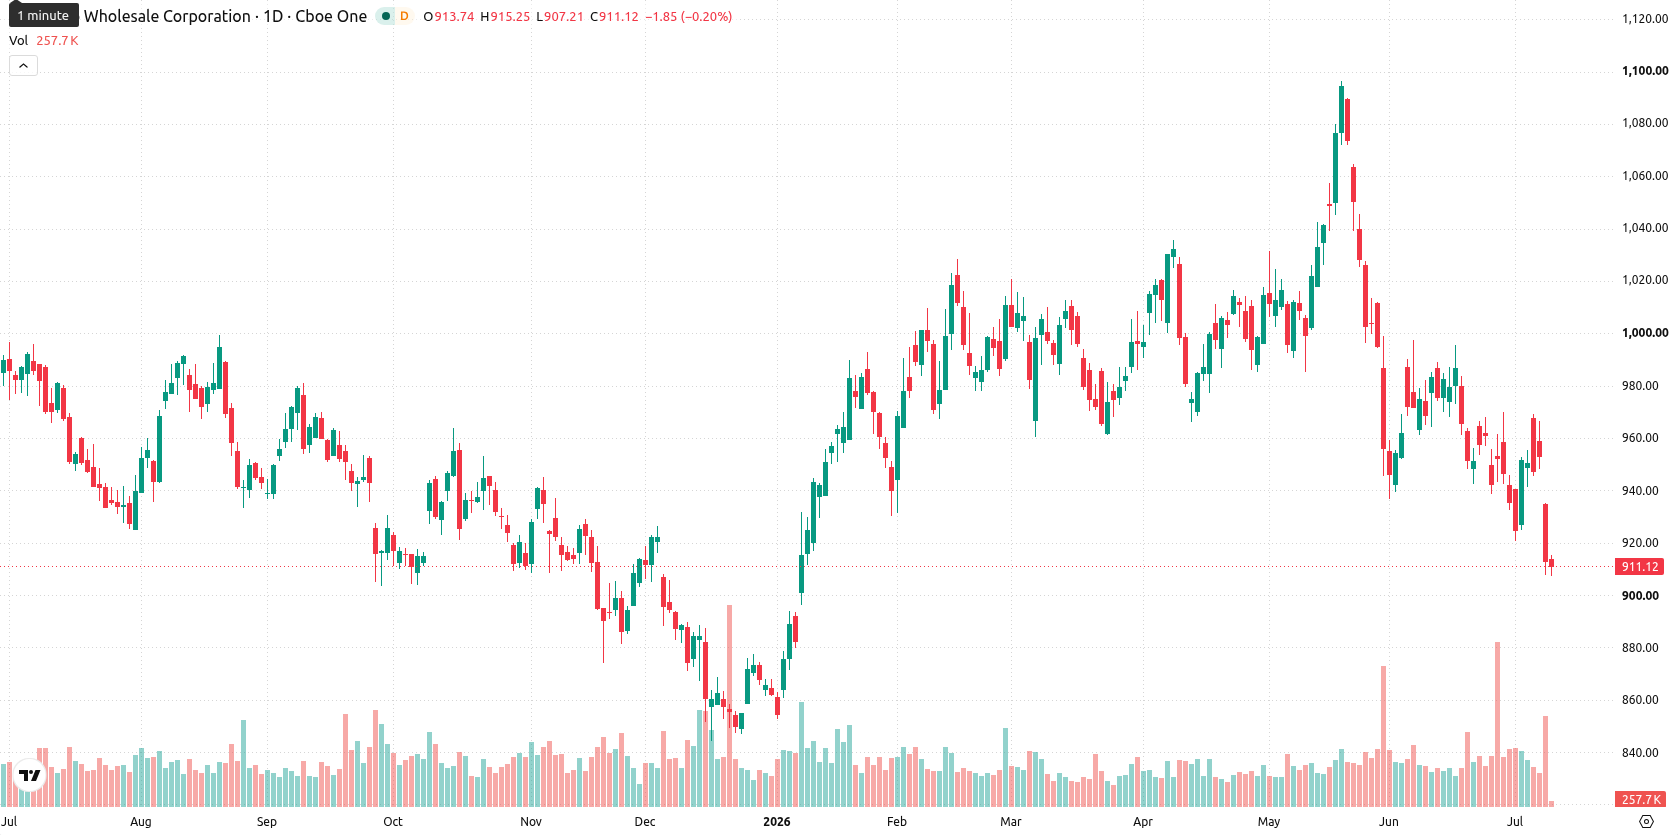
Persistent bearish momentum as oversold conditions intensify this week
On the weekly (W1) chart, Costco remains well below the 20- and 50-period moving averages, suggesting persistent medium-term bearish momentum, while staying above the 200-period MA, which is now the primary long-term support. The key resistance is set at the MA-50 ($956.79), and the nearest weekly support is at $905. Weekly momentum indicators, including MACD and ADX, remain neutral, but major oscillators (RSI, Stochastic RSI, CCI) confirm clear oversold conditions. Weekly Bull/Bear Power is strongly negative, and the Awesome Oscillator continues to reflect firm downside traction, underscoring dominant seller control.
Continued downside risk as rebound signals remain absent for next week
Based on W1 indicators and the latest weekly data, the expected trading range for the next 5 trading days is $905 to $938. With all primary trend and momentum signals still pointing downward and no key technical indicators issuing a Buy or Strong Buy, there is less than a 20% likelihood of a rebound this week. The base scenario calls for continued sideways-to-down movement within this range as the stock seeks new support. A move below $905 could open up further losses toward the longer-term support levels, while an unexpected break above $938 would be needed for any relief rally to gain traction.
Earlier, analysts noted that sustained bearish momentum and valuation concerns were pressuring Costco shares despite strong core sales growth. The current technical setup reinforces this view, with persistent downside signals suggesting traders should closely monitor the $905 weekly support for potential volatility in the coming sessions.










-
 Afghanistan
-
 Albania
-
 Algeria
-
 Angola
-
 Argentina
-
 Armenia
-
 Australia
-
 Austria
-
 Azerbaijan
-
 Bahamas
-
 Bahrain
-
 Bangladesh
-
 Belarus
-
 Belgium
-
 Bolivia
-
 Botswana
-
 Brazil
-
 Brunei
-
 Bulgaria
-
 Cambodia
-
 Cameroon
-
 Canada
-
 Chile
Chile
-
 China
China
-
 Colombia
-
 Congo
Congo
-
 Costa Rica
-
 Cote d'Ivoire
-
 Croatia
-
 Cuba
Cuba
-
 Cyprus
-
 Czechia
-
 DR Congo
-
 Denmark
-
 Dominican Republic
-
 Ecuador
-
 Egypt
Egypt
-
 El Salvador
-
 Estonia
-
 Eswatini
-
 Ethiopia
-
 Finland
-
 France
-
 Georgia
-
 Germany
-
 Ghana
Ghana
-
 Greece
-
 Haiti
Haiti
-
 Hong Kong
-
 Hungary
-
 India
India
-
 Indonesia
-
 Iran, Islamic republic
-
 Iraq
Iraq
-
 Ireland
-
 Israel
-
 Italy
Italy
-
 Jamaica
-
 Japan
Japan
-
 Jordan
-
 Kazakhstan
-
 Kenya
Kenya
-
 Korea
Korea
-
 Kuwait
-
 Kyrgyzstan
-
 Laos
Laos
-
 Latvia
-
 Lebanon
-
 Lesotho
-
 Libya
Libya
-
 Lithuania
-
 Luxembourg
-
 Madagascar
-
 Malaysia
-
 Malta
Malta
-
 Mauritius
-
 Mexico
-
 Moldova
-
 Mongolia
-
 Montenegro
-
 Morocco
-
 Mozambique
-
 Myanmar
-
 Namibia
-
 Nepal
Nepal
-
 Netherlands
-
 New Zealand
-
 Nigeria
-
 North Macedonia
-
 Norway
-
 Oman
Oman
-
 Pakistan
-
 Palestine
-
 Panama
-
 Papua New Guinea
-
 Paraguay
-
 Peru
Peru
-
 Philippines
-
 Poland
-
 Portugal
-
 Puerto Rico
-
 Qatar
Qatar
-
 Reunion
-
 Romania
-
 Rwanda
-
 Saudi Arabia
-
 Serbia
-
 Singapore
-
 Slovakia
-
 Slovenia
-
 Somalia
-
 South Africa
-
 Spain
Spain
-
 Sri Lanka
-
 Sweden
-
 Switzerland
-
 Syria
Syria
-
 Taiwan
-
 Tajikistan
-
 Tanzania
-
 Thailand
-
 Trinidad and Tobago
-
 Tunisia
-
 Turkey
-
 UAE
UAE
-
 Uganda
-
 Ukraine
-
 United Kingdom
-
United States
-
 Uruguay
-
 Uzbekistan
-
 Venezuela
-
 Vietnam
-
 Yemen
Yemen
-
 Zambia
-
 Zimbabwe
- Forex
- Crypto











