

HUT slides as aggressive selling meets immediate support zone

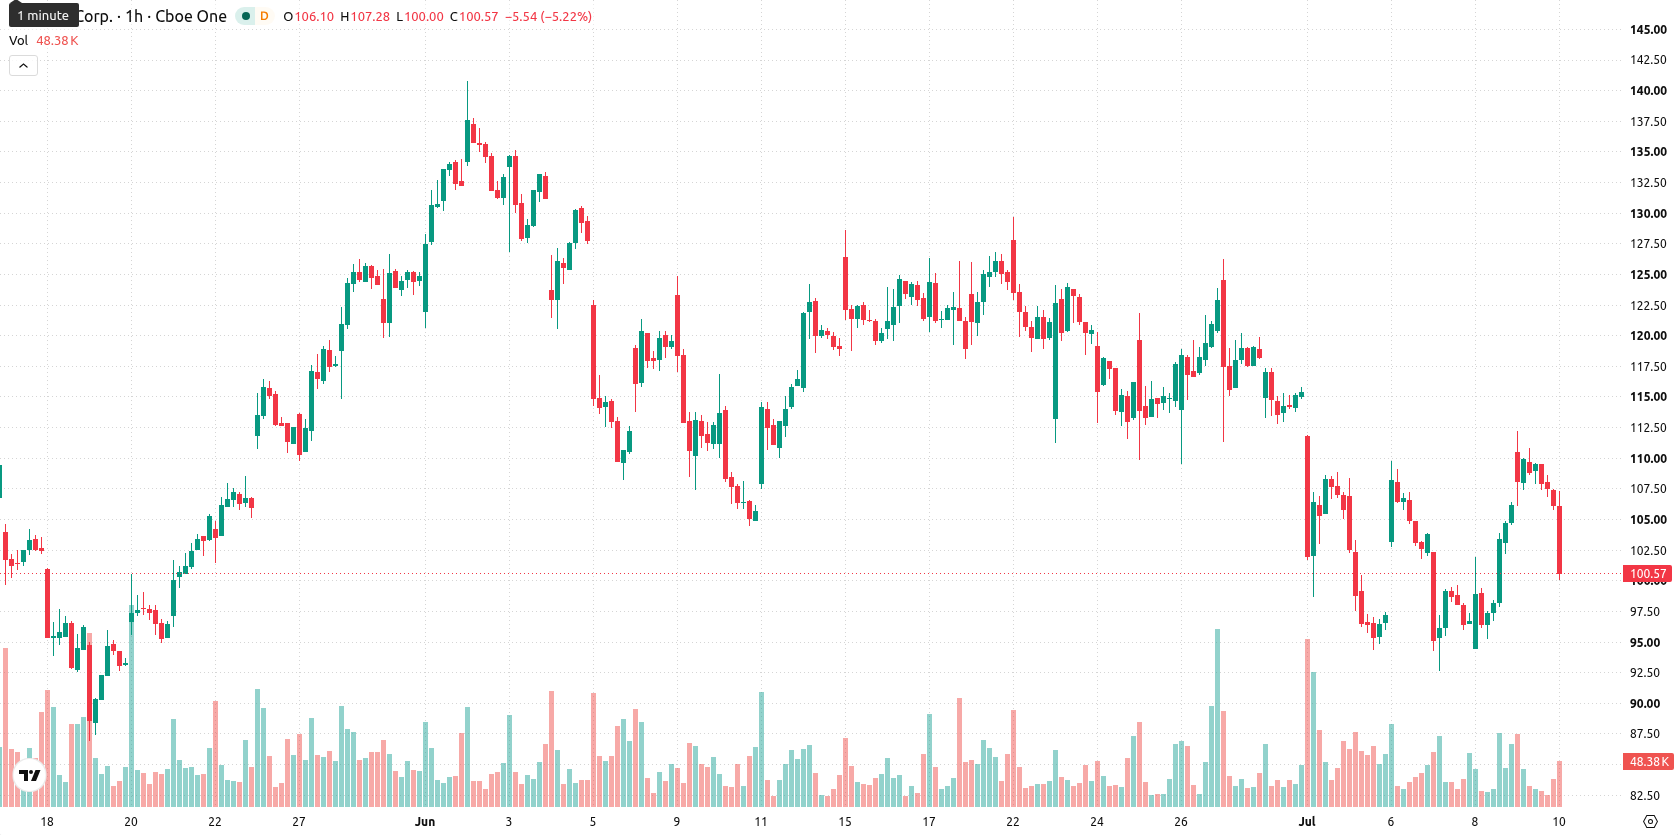
Hut 8 (HUT) stock is trading at $102.42, marking a decline of 3.58% for the session. The share price currently sits below its key moving averages, reflecting recent downward momentum.
 85.64
90.10
85.64
90.10
Highlights
- HUT/USD shows short- and medium-term selling pressure, but the longer-term bullish structure remains intact above key support.
- Momentum indicators are mixed, with most signaling underlying bullish strength despite intraday weakness and an aggressive sell-off into support.
- Forecast expects sideways trading between $93.77 and $111.07, with downside more likely unless immediate support holds and momentum turns.
Bullish momentum diverges from intraday weakness at key support
On the hourly chart, HUT is trading below both the MA-20 at $102.82 and the MA-50 at $104.26, while remaining well above the daily MA-200 at $64.98. The Ichimoku Kijun line at $102.36 is being tested as immediate support. Momentum readings are mixed: the Relative Strength Index (RSI) stands at 55.56, the Moving Average Convergence Divergence (MACD), Average Directional Index (ADX), and Commodity Channel Index (CCI) are on buy signals, although Stochastic RSI and Awesome Oscillator indicate neutral momentum. Bull/Bear Power is in overbought territory, highlighting dominant intraday buying, but recent closing price action near session lows after a 5.68-point opening gap and volatility spike signals aggressive selling into support. There is a strong divergence between bullish momentum indicators and the weak intraday tape.
Range-bound forecast as downside risk outweighs upside odds
Over the next several sessions, HUT is forecast to trade within a volatility band of $93.77 to $111.07. The probability of an upward move is estimated at 35%, while technical analysis points to a greater likelihood of further downward price action. The baseline scenario anticipates sideways movement within this range, with a break above resistance favoring a move toward the upper boundary, while a failure of immediate support could open the way for a test of the lower end of the range.
Earlier, analysts noted that Hut 8 was demonstrating broad-based technical strength with a bias toward consolidation and potential upside movement. However, recent price action and a lower probability of gains now highlight downside risks, making the durability of immediate support levels critical for the near-term outlook.





Latest Hut 8 News






-
 Afghanistan
-
 Albania
-
 Algeria
-
 Angola
-
 Argentina
-
 Armenia
-
 Australia
-
 Austria
-
 Azerbaijan
-
 Bahamas
-
 Bahrain
-
 Bangladesh
-
 Belarus
-
 Belgium
-
 Bolivia
-
 Botswana
-
 Brazil
-
 Brunei
-
 Bulgaria
-
 Cambodia
-
 Cameroon
-
 Canada
-
 Chile
Chile
-
 China
China
-
 Colombia
-
 Congo
Congo
-
 Costa Rica
-
 Cote d'Ivoire
-
 Croatia
-
 Cuba
Cuba
-
 Cyprus
-
 Czechia
-
 DR Congo
-
 Denmark
-
 Dominican Republic
-
 Ecuador
-
 Egypt
Egypt
-
 El Salvador
-
 Estonia
-
 Eswatini
-
 Ethiopia
-
 Finland
-
 France
-
 Georgia
-
 Germany
-
 Ghana
Ghana
-
 Greece
-
 Haiti
Haiti
-
 Hong Kong
-
 Hungary
-
 India
India
-
 Indonesia
-
 Iran, Islamic republic
-
 Iraq
Iraq
-
 Ireland
-
 Israel
-
 Italy
Italy
-
 Jamaica
-
 Japan
Japan
-
 Jordan
-
 Kazakhstan
-
 Kenya
Kenya
-
 Korea
Korea
-
 Kuwait
-
 Kyrgyzstan
-
 Laos
Laos
-
 Latvia
-
 Lebanon
-
 Lesotho
-
 Libya
Libya
-
 Lithuania
-
 Luxembourg
-
 Madagascar
-
 Malaysia
-
 Malta
Malta
-
 Mauritius
-
 Mexico
-
 Moldova
-
 Mongolia
-
 Montenegro
-
 Morocco
-
 Mozambique
-
 Myanmar
-
 Namibia
-
 Nepal
Nepal
-
 Netherlands
-
 New Zealand
-
 Nigeria
-
 North Macedonia
-
 Norway
-
 Oman
Oman
-
 Pakistan
-
 Palestine
-
 Panama
-
 Papua New Guinea
-
 Paraguay
-
 Peru
Peru
-
 Philippines
-
 Poland
-
 Portugal
-
 Puerto Rico
-
 Qatar
Qatar
-
 Reunion
-
 Romania
-
 Rwanda
-
 Saudi Arabia
-
 Serbia
-
 Singapore
-
 Slovakia
-
 Slovenia
-
 Somalia
-
 South Africa
-
 Spain
Spain
-
 Sri Lanka
-
 Sweden
-
 Switzerland
-
 Syria
Syria
-
 Taiwan
-
 Tajikistan
-
 Tanzania
-
 Thailand
-
 Trinidad and Tobago
-
 Tunisia
-
 Turkey
-
 UAE
UAE
-
 Uganda
-
 Ukraine
-
 United Kingdom
-
United States
-
 Uruguay
-
 Uzbekistan
-
 Venezuela
-
 Vietnam
-
 Yemen
Yemen
-
 Zambia
-
 Zimbabwe
- Forex
- Crypto












