
INTC pullback extends as support pressure grows after recent selloff.

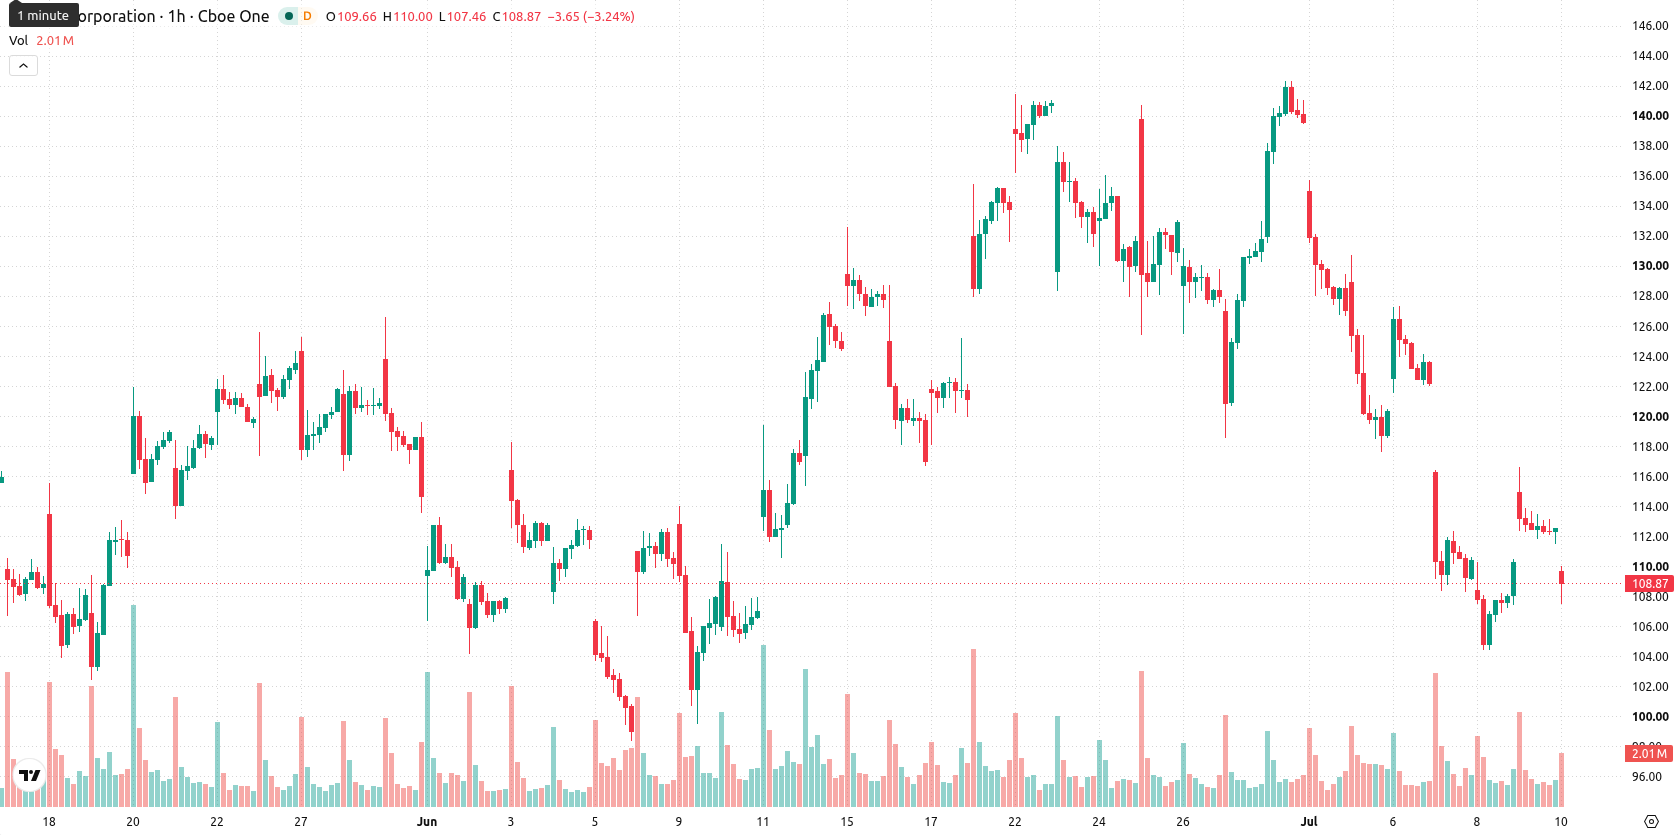
Intel (INTC) stock is trading at $109.08, down 3.3% on the day. The price currently sits below its key moving averages.
 109.51
127.30
109.51
127.30
Highlights
- INTC faces short- and medium-term bearish momentum, trading below key moving averages despite retaining long-term trend support.
- Bearish sentiment dominates as MACD, ADX, and RSI signal further downside, while oscillator divergence creates short-term uncertainty.
- Price likely consolidates between $98.84 and $119.32, with immediate resistance at $114.69 and risk of accelerated weakness if support fails.
Technical momentum weakens amid mixed indicator signals
On the technical side, INTC is trading below the MA-20 at $110.22 and the MA-50 at $120.73 on the hourly chart, while staying above the long-term MA-200 at $62.05 on the daily timeframe. Immediate resistance is identified at the Ichimoku Kijun level of $114.69. The Moving Average Convergence Divergence (MACD) shows a strong sell signal and the Average Directional Index (ADX) registers a sell bias. The Relative Strength Index (RSI) is at 46.65, indicating a sell, while both the Stochastic RSI and Bull/Bear Power are overbought, pointing to possible short-term buyer exhaustion; the Commodity Channel Index (CCI) diverges with a buy signal. The Awesome Oscillator is neutral and does not reinforce the prevailing trend.
Downside risk prevails as resistance and support levels tighten
In the short term, price action for INTC is projected to fluctuate between $98.84 and $119.32 as a likely volatility band relative to current levels. Upside probability over the next few days is estimated at 37%, while downside stands at 63%, suggesting a higher chance of further weakness. A bullish scenario would require a close above immediate resistance at $114.69, while a break below the support zone near $98.84 could accelerate short-term declines.
Earlier, analysts noted that Intel shares were facing heightened risk of weakness amid profit-taking and sector rotation away from semiconductors. The current setup, with multiple technical indicators skewed bearish and short-term downside probability elevated, reinforces this caution and suggests traders should monitor the $98.84 support as a key level for further deterioration.



Latest Intel News





-
 Afghanistan
-
 Albania
-
 Algeria
-
 Angola
-
 Argentina
-
 Armenia
-
 Australia
-
 Austria
-
 Azerbaijan
-
 Bahamas
-
 Bahrain
-
 Bangladesh
-
 Belarus
-
 Belgium
-
 Bolivia
-
 Botswana
-
 Brazil
-
 Brunei
-
 Bulgaria
-
 Cambodia
-
 Cameroon
-
 Canada
-
 Chile
Chile
-
 China
China
-
 Colombia
-
 Congo
Congo
-
 Costa Rica
-
 Cote d'Ivoire
-
 Croatia
-
 Cuba
Cuba
-
 Cyprus
-
 Czechia
-
 DR Congo
-
 Denmark
-
 Dominican Republic
-
 Ecuador
-
 Egypt
Egypt
-
 El Salvador
-
 Estonia
-
 Eswatini
-
 Ethiopia
-
 Finland
-
 France
-
 Georgia
-
 Germany
-
 Ghana
Ghana
-
 Greece
-
 Haiti
Haiti
-
 Hong Kong
-
 Hungary
-
 India
India
-
 Indonesia
-
 Iran, Islamic republic
-
 Iraq
Iraq
-
 Ireland
-
 Israel
-
 Italy
Italy
-
 Jamaica
-
 Japan
Japan
-
 Jordan
-
 Kazakhstan
-
 Kenya
Kenya
-
 Korea
Korea
-
 Kuwait
-
 Kyrgyzstan
-
 Laos
Laos
-
 Latvia
-
 Lebanon
-
 Lesotho
-
 Libya
Libya
-
 Lithuania
-
 Luxembourg
-
 Madagascar
-
 Malaysia
-
 Malta
Malta
-
 Mauritius
-
 Mexico
-
 Moldova
-
 Mongolia
-
 Montenegro
-
 Morocco
-
 Mozambique
-
 Myanmar
-
 Namibia
-
 Nepal
Nepal
-
 Netherlands
-
 New Zealand
-
 Nigeria
-
 North Macedonia
-
 Norway
-
 Oman
Oman
-
 Pakistan
-
 Palestine
-
 Panama
-
 Papua New Guinea
-
 Paraguay
-
 Peru
Peru
-
 Philippines
-
 Poland
-
 Portugal
-
 Puerto Rico
-
 Qatar
Qatar
-
 Reunion
-
 Romania
-
 Rwanda
-
 Saudi Arabia
-
 Serbia
-
 Singapore
-
 Slovakia
-
 Slovenia
-
 Somalia
-
 South Africa
-
 Spain
Spain
-
 Sri Lanka
-
 Sweden
-
 Switzerland
-
 Syria
Syria
-
 Taiwan
-
 Tajikistan
-
 Tanzania
-
 Thailand
-
 Trinidad and Tobago
-
 Tunisia
-
 Turkey
-
 UAE
UAE
-
 Uganda
-
 Ukraine
-
 United Kingdom
-
United States
-
 Uruguay
-
 Uzbekistan
-
 Venezuela
-
 Vietnam
-
 Yemen
Yemen
-
 Zambia
-
 Zimbabwe
- Forex
- Crypto











